Go Daddy Signup

Showing posts with label TWTR. Show all posts

June 27, 2017

Mr. Market, Yellen, Gold, Tech stocks and bubbles

Markets, Yellen, Fed, gold, Tech stocks and bubbles

Well another week and Monday markets were up and all the bulls were running around predicting that the markets were headed higher. Sure enough we had a down week last week and Grandma Yellen's move to tighten is still being partially ignored by the markets. TLT or bonds were moving higher with yields moving down. We like TLT and have been long since 120. Check the chart here:


There was a heavy rotation into the biotech stocks this past week. The move in the biotech ETFs such as XBI, IBB and BIB were excellent and look like weekly breakouts. We expect these to move higher based on their weekly chart patterns. Check these charts below and we would expect a pullback before we would take any long positions.

Weekly charts:


We believe the rotation is coming out of tech stocks and moving into alternate investments that have been lagging. There is no question that we are in a bubble mode for all assets - the question is, when will this bubble burst. Over 90% of the tech stocks are trading at ridiculous PEs and valuations (that are above the 2000 stock bubble). 

Even with Fed tightening, central banks around the world are still in easing and loose monetary policy mode. 

Gold has been bouncing around this level between 1200 - 1330 for quite some time. Technicals are negative and we have to see a decisive break above the weekly moving averages of 13, 50 and 100 to turn bullish. We do not see that happening unless there is a monetary crisis a.k.a China Yuan or some other country currency crashing.

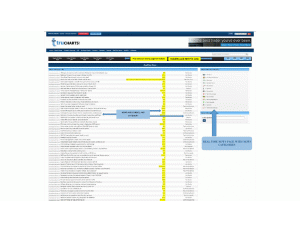
In the tech stocks we like, QCOM and WDC. These stocks relative to their peers are cheap and have good dividends and low PEs. We also like Alibaba - BABA, TWTR (if weekly close above $19.5) and would short NVDA. Please keep tight stops at 5% below 50d SMA or 20 week SMA. You can find these values on our site when you plot the charts on the www.trucharts.com/stockcharts.aspx page. 

We have added new features such as customizable multiple screener for various technical signals on our site under "Screener" menu option - check it out.  

We have video tours of our site on how to use the site effectively - please do check it out.

We have a discounted subscriber pricing which is at $10 per month or $120 annually. Please check this out on our subscriber page.

Good luck trading.

B. Bhatia
Founder/CEO - Trucharts.com


June 21, 2015

Positioning your portfolio - Summer 2015 and Markets Direction - Blog Trucharts.com

Trucharts.com - Market positioning and where markets are for the summer - Blog Update for Week ending 6/19/2015


Well we guess by now you are all used to the volatility and jerky moves in the markets for the past few weeks. Markets that move sideways for a long period of time are either topping, consolidating, and what we call confused markets. For the past several weeks, we have been seen these wild 3 digit moves up and down and primarily the markets holding the 18000 for the DOW, 2100 for SP500 and now 5100+ for the NASDAQ. This has been occuring every single week. The Russell 2000 hit a new high as did the NASDAQ and everyone is ready to party like its 1999. 

Market pundits are trying to justify why the market valuations are low compared to 2000 - but some of their points sound absurd. Granted there are companies with good earnings and low PE ratios - but these are few and far between. Zero rates from the Fed, market speculators, big firms and heavy stock buybacks are the reasons driving this market and we have shown several examples of charts that look like exponential chart patterns. With everyone chasing performance and yield, stocks have been the only game in town and therefore we are seeing astronomical valuations for many companies - especially in biotech and stocks that are up for no reason (check the charts for stocks (for last 7 years period) like UHAL Chart; SHW chartAMBA chartIBB chartREGN chart and many others. 

Here are the charts for DIA chartSPY chartIWM chart and QQQ chart from the week ending 6/19. You can see the DIA and SPY have not broken out yet and based on the market internals, we are seeing some fundamental weakness in the Industrial stocks, Utility stocks and the individual DOW component stocks - just check here the DOW 30 stocks with the mouseover charts feature: here is the link - DOW 30 stocks - check each chart and you will see how each of these stocks are doing currently.  

As we write, futures are up as Greece is trying to avoid printing drachmas and stay within the Euro zone. This is like the never ending story - it is like a soap opera - with the Greek Prime minister and the finance minister playing lead roles and the Germans are getting tired of it - but do not have a choice but to deal with it.

What should you be doing now: 

We would take a very defensive posture here and take some profits in profitable positions and sell some covered calls, and to protect downside risk with buying some puts on your positions - maybe 10% below (strike price) the current price - these are cheap, knowing that the volatility (VIX) is low and the puts would be cheap insurance. We typically hedge our positions as long and short and try to keep our portfolio balanced. We definitely still think there is risk here on the downside. 

NASDAQ is being hitting new highs primarily because it is being driven by the biotech stocks. These stocks may still go higher, but as they do, so does the risk. In addition, many new IPOs are healthcare related and biotech focused. We would be wary of trading these - unless you have the stomach or risk profile to handle volatile stocks. 

From a stock perspective, we are long BIDU, CYBR, Z, TWTR - we like MO, PM here for short term trades. We missed BTI at 104 (major support). We are short AMBA, and INTC.    
Here is a recap of some of the interesting articles we liked and have provided the links here:

What is the meaning of a "dry-bubble" to VCs?
http://www.zerohedge.com/news/2015-06-17/silicon-valleys-fantastic-dry-bubble

China bubble news:
http://www.zerohedge.com/news/2015-06-20/so-you-think-you-are-rich

California Drought:
http://www.zerohedge.com/news/2015-06-18/california-has-never-experienced-water-crisis-magnitude-%E2%80%93-and-worst-yet-come

TSMC and AAPL news - very interesting read and outlook on semi stocks:

Till next week. 

Good luck trading.

May 17, 2015

Where are the markets headed - UP or DOWN?

Trucharts.com - Blog Update - Week ending 5/15/2015

Where are the markets headed - up or down??

We were unable to publish our blog for week ending 5/8 as we were in China due to blogging restrictions. We are going to summarize the market events for the last two weeks and provide our outlook for the coming weeks and thoughts on some trading.

Well we noticed a pattern during the past two weeks - markets would be sluggish during the early part of the week and then ramp into the end of week trading - week of 5/8 we had a huge move on Friday and last week the big move occured on Thursday. Bonds which have been crushed for the past few months (see TBT chart below) bounced back and it is currently oversold and we expect TBT to move up to its 50d SMA. This will lead to a drop in yields in the coming weeks and interest sensitive stocks should move higher - housing stocks like DHI and LEN to move higher. Markets moved higher on Thursday due to the lower retail number print and the jobless claims number. The markets are totally schizoprehnic - every data point is like a tug of war between the bulls and the bears - but we think the bulls are winning.

The indices like S&P500 brokeout to a new high last week and we expect the move higher. Check the charts below for DIA, SPY, SVXY and TNA. With the Fed pumping money into the economy and staying on the sidelines with the low or ZIRP will drive stocks higher. The Fed is stuck in a corner and we have been saying this for weeks. There is internal strife within the Fed governors and there is lot of jawboning going on the interest rate hike front. This is creating a stable trading environment in stocks - we especially like the drug stocks and stocks with weekly option expirations. The NASDAQ moves are being dictated by the biotech stocks. We expect the biotech ETFs to move higher here - these have still not closed below the 13 week SMA.

Our USO position closed on Friday, we are looking to go long BIDU,TWTR. Oil did bounce back and is back at being above $60. Gold rallied and we expect a pullback. The Greece situation has been nothing but noise. Eurozone economies did well due to the pullback in the Euro, but the markets saw a pullback last week. China is in a bubble and will not end until everyone is loaded up - there is a billionaire being made every week - reminds us of the 2000 Nasdaq tech bubble. 

We are still long MO,DNKN,BIDU and we will close our BOX position this week.

ISEE C/P ratio hit a new 52 week high on Thursday - it recorded a reading of 228 and that means over 2.2 calls were being bought for every put. This typically points to a higher market. Hedges are cheap now as volatility is low and we recommend buying some SPY puts and or puts for your positions at 10% below for 30d out timeframe.

Checkout our backtest article we posted last week for our site and also check out excellent subscription rates for full access and it is currently discounted at 50% for one year access - here is the link - http://www.trucharts.com/truCharts_Services.aspx and we would really appreciate if you can spread the word for our site - and create a buzz - we know we have one of the best stock charting sites on the web. We have updated our home page and are still adding features daily. Check these out and send us your feedback - support@trucharts.com - your feedback is so critical to help us improve our user experience. 

Closed EEM short.

Here are some articles for some good reading this week. 

http://www.zerohedge.com/news/2015-05-16/what-goldman-telling-its-clients-sell-may-and-dont-come-back-one-year

http://www.zerohedge.com/news/2015-05-16/one-gauge-investor-sentiment-just-hit-6-year-high

http://www.zerohedge.com/news/2015-05-17/presenting-77-billion-p2p-bubble

Here are the charts we are watching this week:


Good luck trading. 

Trucharts Team


April 26, 2015

We made over 18% in three weeks? What did you trade?

Trucharts.com Blog week ending 4/24/2015

Free Stock Chart(s), Technical Screener, MACD Charts, Scanner, Real Time Stock News, Stock Patterns, Stock Quotes, Portfolio Management, Earnings Calendar and more:

Well the stock markets have been going through a nice up trend with this earnings season in full force. Stocks in many sectors were rocking and not so in some sectors. The technology semiconductor sector looks like it has topped out in earnings - check how AVGO, NXPI, TXN (reported earnings and tanked) and many others are pointing to a slowdown in this sector. We were short SMH and recommending shorting NXPI and AVGO in our last blog. We would stay short SMH.

In addition, next week we have the moment of the quarter earnings from AAPL on Monday and then TWTR on the 29th (and BIDU also). FB (Facebook) earnings did not look strong and we still do not like FB due to its valuation. Google stock moved, primarily due to short covering. AMZN was a blowout - unfortunately we think here it is expensive here - even though it may move higher. The earnings will keep going this week and you can check the earnings calendar for your stock on our stockview page in the data box and on our earnings calendar page at: Earnings Calendar.

Here is a stock we talked about shorting and looks like a great candidate for short - please always hedge your position by buying an out of the money call. We always hedge our positions. Stock is IPGP and here is the chart:


Stock is closed below 13d and 50d SMA - target would be 85 and below.


Gold got killed last week but we think this is going to be range bound from $1100 to $1200 and we will keep a close eye on this. Some commodity stocks did well this past week - check out RS, VALE.

Markets are still trending higher - we think there is a chance for a breakout here and we have to see if there is follow through. Chinese markets are on a roll - bubble brewing but not over yet.

Now how did we make 18% - we traded TWTR stock - TWTR has been range bound between 49 and 53 and we bought the stock for 3 weeks in a row and wrote the covered calls for each of those weeks, since TWTR has weekly options. We traded 400 share blocks and our investment was $10000 and our net profit was $1800. Total return - 18%. We are still long TWTR and plan to stay long into earnings - we think TWTR is beating FB (facebook) and is growing now. We will write covered calls for next week May 1st - Friday for part of our position.  Anyway - I wil be traveling this week and will still try to publish and update the blog next weekend. Check out our site for excellent real time stock news and excellent features like mouseover charts/automated buy and sell signals for any stock which you will find on no other sites. We charge the lowest subscription fee for full access to our site. We need your support and we have been providing actual trades and the best picks for the last 6 months - all for free.

April 16, 2015

Just Keep Buying; Just Keep Buying -

Trucharts.com - Mid week markets update:

SEO: BIDU stock, BIOTECH, Blog, Free Stock Charts, Hedge Fund update, Hot stocks, TWTR, MO, MACD charts

The markets are on edging on the verge of a breakout - and looks like now we have to catch up with the bubbles in China, India and Hong Kong - money printing eventually always leads to bubbles and all the central banks do not care - under the guise of slowing economies - money printing and 0% interest rates are driving an asset and stock bubble - the central banks will never admit it, even if it is staring it right in their faces - since they are scared shit to raise rates. This has led to property bubbles and stock bubbles - no one can tell now when this will end - but when it does - watch out below - this is totally unsustainable and complacency is becoming the norm - unbelievable. Bubbles after bubbles and the only folks making money from this are the VC's who love companies with no earnings going IPO and they cash in really good. 

For now our motto is: like the fish in the NEMO movie says -  

"Just keep buying, just keep buying" (like "just keep swimming..."). 

We closed CAT today. Our SNDK short worked well and we will close position today. We like ETSY here but want to wait for a week to buy. Still long BIDU & USO (doing very well). Our MO position is also doing good and as is TWTR.

Trucharts team

April 12, 2015

What will you trade this week? We like these stocks...

Trucharts.com Blog - Updated - week ending - 4/10/2015

What will you trade this week? We like these stocks...

A hectic week and now the earnings train will come to town this week. So many earnings, and we can expect, very likely a lot of surprises and disappointments - we love Wall Street - they have been lowering the earnings estimates and then it is very likely that the company will beat the lowered estimates and everyone looks like a hero - the CEO, the analyst, CNBC and news guys love surprises. Is it going to be a train wreck or a smooth ride - what is the Q2 forecast going to be like - these are the questions we need to think about.


In the background we have the Euro dropping, oil moving higher and gold also. The European markets are ripping and now the experts are predicting if the British pound is going to drop thereby driving British stock market higher - well we are in a currency war now. The Chinese and Hong Kong stock markets are on an exponential move and we had pointed to an article on our twitter post  https://www.twitter.com/trucharts) about how housewives in China are now playing in the Chinese and Hong Kong markets. This is not about to end yet - bubbles do not end abruptly - these end when everyone on the streets, including your barber, is talking about stocks. So, still a ways to go.  


Well let us see our markets - the biotech sector bounced perfectly off its 50d SMA average, as did many of the biotech stocks. The DOW, and SP500 are exhibiting a wedge pattern, which seems to be pointing that the markets may breakout here. The NASDAQ which is primarily being driven by the biotech stocks seems to be forming a right shoulder - check the charts on our home page.


Well what will you trade this week - the tech stocks - the big industrials - check the earnings calendar on our site at: (http://www.trucharts.com/EarningsView.aspx) - additionally, we show the date on the stock charts page as shown below (see red marked box on the right corner):


We are going to close our AEM position and SNDK.

Well what stocks are we going to trade: Here are our picks - be mindful of the earnings dates:

We closed BIDU and TWTR in one account - but here are the charts we like this week:

1. www.trucharts.com/stockview.aspx?TICK=CAT - earnings are on 4/23 - but the chart looks 
    excellent

2. www.trucharts.com/stockview.aspx?TICK=TWTR - earnings are on 4/28 - we like TWTR


4. www.trucharts.com/stockview.aspx?TICK=USO  - ETF - has a good chart


We had picked MYL, TEVA, LLY, ABBV, LO, RAI and M in our last blog and all of these did very well. We still like LLY (watch earnings date).

Check out our best rates for subscribing to our site at - we offer the best feature set on the web: http://www.trucharts.com/truCharts_Services.aspx

Best of luck trading.

Trucharts Team 


April 7, 2015

Hot stock picks!!

Trucharts.com - Free Stock Charts, Scans, Dividend Stocks and more


HOT STOCK PICKS!!!

We talked about our picks in our weekly blog update and these were the HOT STOCKS we picked:

M        - Macy's Up to 68.74 - picked at 68.01 - was up to 69 this morning
TWTR  - Picked at 49.95 - Up today to 52.35 - or over $2
MO      - Picked up at 50.95 - up today to 51.90

We like LLY here.

Trucharts team

January 11, 2015

Trucharts.com - Blog and stocks to watch week ending - 01/09/2015

Trucharts.com Blog week ending 01/09/2015 - HELE, TWTR, SCO, USO

What a volatile first trading week of the year. We were negative for the year and then after the huge move up with the VIX above 20 - traders came in drove the market up over 500 points. And then on Friday we had the consolidating pull back. Even stocks like MU which guided lower revenue forecast to the analyst estimates for Q1 rallied after falling sharply. There was expectation that EU zone will unleash a QE and with nterest rates going negative in some of the EU countries - the markets rallied. In addition, we still have the Russian ruble crisis and the oil drop is definitely hurting the Russian economy, and the Venezuelan economy. The talking voices and experts on TV keep telling us that the drop in oil is due to lower demand and supply glut - I call that complete BS. This drop in oil is a politically driven - there is no way oil can drop 50% unless economies around the world are crashing - it is like saying 50% of the cars and oil consumers around the world suddenly stopped driving and the oil supply jumped by 100% - does this this sound reasonable at all. I believe oil will stabilize around 45 and move up to 70 from this very oversold rally - keep an eye on SCO the oil short ETF which is very extended - we woud look to buy puts on this ETF - check out the chart - www.trucharts.com/stockview.aspx?TICK=SCO. 

We are long USO, LINE and look to go longer in oil stocks or ETFs. We will wait for the signal. There is too much negative sentiment on oil. Surprisingly - gold and gold stocks and gold ETFs moved up last week - we think this was driven by a run to safety and the falling dollar from the extended move up.

During the rally, Advancers vs Decliners was almost 8:2 on the NYSE and the NASDAQ. Here are the numbers for the A/D and volume from Friday close:


Advances & Declines
NYSE
AMEX
NASDAQ
Advancing Issues
1,163 (36%)
202 (50%)
913 (33%)
Declining Issues
1,975 (61%)
187 (46%)
1,785 (64%)
Unchanged Issues
92 (3%)
15 (4%)
101 (4%)
Total Issues
3,230
404
2,799
New Highs
152
11
77
New Lows
63
8
54
Up Volume
985,074,941 (29%)
52,720,491 (60%)
606,206,477 (36%)
Down Volume
2,335,614,656 (69%)
32,671,019 (37%)
1,034,281,930 (62%)
Unchanged Volume
49,081,860 (1%)
2,604,305 (3%)
24,354,296 (1%)
Total Volume
3,369,771,4571
87,995,8151
1,664,842,7031

This week is start of earnings week with AA (Aloca reporting tomorrow) - check the earnings calendar on our site at: www.trucharts.com/earningsview.aspx.

Here is an excellent article on the PE and the markets this week:http://www.zerohedge.com/news/2015-01-10/permabull-throws-towel-stocks-are-massively-overvalued-key-multiples-are-post-war-re

This article tells us that we are at a critical juncture in the markets - we highly 
recommend taking some profits.

Another article: http://www.bloomberg.com/news/2015-01-12/this-guy-called-bonds-in-14-you-listening-this-time-.html?cmpid=yhoo

On our stockview page - you can see the earnings date on the top right hand side of the data box for any particular symbol. We closed our YHOO position last week and we have been watching and keeping an eye on the utility stocks. The financial stocks like BAC and others pulled back - we have no positions in these stocks.

Our long positions are AMKR, USO, LINE, WSM, CYBR, K, and TWTR. Our short positions are GM,F,IBB,DAL.

We like the following stocks for next week:

TWTR - we think the rumors of a buyout are driving the stock higher - we went long on Friday - here is the chart: Charts:


January 9, 2015

TWTR stock at Trucharts.com and more

Trucharts.com - TWTR stock


As we indicated yesterday, we went long TWTR today - we think this is headed to 42.

Markets pulled back today - should be expected after such a huge run - we think the retail news from GPS (Gaps) and BBBY (Bed Bath and beyond) was not good - but we will keep an eye out for retail stocks. 

We are short GM, F, IBB, DAL.

We are long TWTR, CYBR, K, USO, LINE, WSM.

Gold stocks were moving higher today.

There is a very interesting divergence going on between gold and oil and the commodity complex - we suspect this maybe due to the currency weakening in the Eastern Block and other countries vs the USD. The junior gold miners are seeing some heavy buying activity - is gold going to go up this year?

Check out our market reports page at: www.trucharts.com/marketreports.aspx - this helped us pick TWTR.

December 21, 2014

TruCharts.com – Free Stock Charts – Blog week ending 12/19/2014

Trucharts.com Blog week ending 12/19/2014

For SEO: Trucharts.com – Stock Charts Free, Stock Market, Stocks, Charting, Dividend Stocks, World Markets, Technical Analysis, Market Sentiment Charts
Merry Xmas and happy holidays to all. We are in a short week of trading this week and the fireworks were on last week after Fed Speak. We did not expect any surprises from the Fed on the raising of the Fed Funds rate, and the Fed made it a point to tell the markets that it was still ok to take risks and that drove the markets to recover over a 800 points on the DOW and 100 points on the SP500. A lot of this was driven by energy stocks and since some of the stocks had dropped over 50% – there were short covering rallies and bottom fishing and a major short squeeze. BofA Merrill Lynch downgraded several semi stocks but these did not correct as much. The SP500 and DOW look like they are still in an uptrend and our indicators are still showing a trend for the markets to mover higher – after a short consolidation period. The move this past week was massive, but the volumes in some stocks was not high. 
We like XLU (www.trucharts.com/stockview.aspx?TICK=XLU) and the utility stocks as good dividend earners. Check out the charts for SO, ED, PCG and DUK. Even the REIT’s look good and some consumer staple stocks look good. We took a position in K or Kellog (www.trucharts.com/stockview.aspx?TICK=K) and USO – we believe this has finally bottomed for the short term. Keep an eye on CAT (www.trucharts.com/stockview.aspx?TICK=CAT) – we are looking to take a position in CAT. 
We have been hurt by our short position in IBB – but have been writing puts to improve our short price. Our other positions are doing OK – Long WSM, short YHOO (plan to close Monday), DAL, AEM. We are looking to go long CYBR.
There is definitely a XMAS rally going on and we expect this to last into the New Year – until the earnings season starts. AAPL (www.trucharts.com/stockview.aspx?TICK=AAPL) still looks good technically.
We added some new features to our site this week – execiting stuff:
1. MULTIPLE SYMBOL CHARTS on one page – check this feature out at: http://www.trucharts.com/multiplestockcharts.aspx
2. ICHIMOKU cloud indicator on our stockview page and turtle trade indicator
3. Added borders to our charts
Check the features out and also our page: http://truchartscom.blogspot.com/p/why-is-trucharts.html
In addition, we want everyone to take advantage of avoiding monthly recurring fees  and sign up NOW for one very low annual membership for full access for just $90/year – a 50% discount to the annual membership fees and this gives you real time categorized news and complete access to all of the site including dividend stocks etc.
Again – Best wishes for the holidays to all and a Happy New Year and good luck trading.

TruCharts Team

November 16, 2014

Trucharts.com Stocks to Watch and Markets Blog Update Week ending 11/14/2014

Trucharts.com Markets Blog Update Week ending 11/14/2014

Markets have been vacillating and staying within a very tight range and always moving higher into the close. The VIX gets slammed at the end of the day and the markets bounce back – even though we are seeing narrow breadth and narrow leadership in the stocks driving the markets. We have ramped very fast from the correction in October and the markets appear to be topping out here. Individual stocks have been seeing some movement – but no sector other than the transports stands out. There is no question that this is definitely a trader’s dream come true – stocks move quite nicely and smart traders (day traders and short term traders) are taking advantage of this volatility in the stocks. Take a look at the stocks like Z, AMZN, BIDU, TSLA and many more momo stocks.
Our sentiment indicators are showing that the markets will stay within a tight range and, as we stated in our earlier blogs, markets will not correct into the Thanksgiving holidays. We can expect volatility but no major moves (unless there are black swan events). The GOP is going to take some time off from their victory in the mid-term elections and come back with a fresh agenda in January and let the President take it easy for the holidays.
The move in gold this Friday looks like a BULL trap – be mindful – the trend is still down and the move in the gold miners also was not on convincing volume. We would sell into the gold rally – the move was due to the coming referendum in Switzerland for the repatriation of their gold. We do not expect this to pass, and the day the this does not pass – watch gold – we think it will drop over $100 (just our speculation). We are short AEM and will stay short. Our prediction for gold price is still at least $1000.
Our IBB short is still in play and we expect the BIOTECH unwinding to start – it started on Friday. Mutual Funds will start to take profits in this sector and will try to show good performance into the end of the year.
The China stock market is coming off a bottom and since the link with the Hong Kong stock exchange, the China ADRs have been moving up quite well.  Surprisingly, we missed BIDU but we have been long JRJC (www.trucharts.com/stockview.aspx?TICK=JRJC) and are looking for stocks in the China ADRs for good buy candidates – we like WUBA – here is the chart – check the weekly and daily chart – (www.trucharts.com/stockview.aspx?TICK=WUBA). Check the weekly technicals:
Here is the chart for reference:
WUBA Stock Chart
We have a special offer for the holidays on our yearly subscription – 50% discount – check this at the following link:
The following is the list of stocks we will be watching this week:
Z                    - www.trucharts.com/stockview.aspx?TICK=Z
TRLA              - www.trucharts.com/stockview.aspx?TICK=TRLA
CYBR, WIFI, TWTR.
We are long CYBR. We closed our USO position at a loss - we were stopped out of the position. Always remember capital preservation is key.
Here is the Help file image for our real time news page:
Stock Market Real time News - Trucharts.com
Trucharts.com Realtime News Help

November 12, 2014