Trucharts.com - Blog and markets Update for week ending 11/7/2014
Mid-term elections done - well the GOP won and now we have to see their agenda. Employment news - which was so-so and with that we had, oil rallying after being trounced, gold rallying on Friday after hitting new lows and the gold miners rising. Markets hitting new highs and VIX dropping (as we had been indicating for quite some time) - we still expect the VIX to drop and markets to consolidate their gains here and breadth is narrow. Markets are heading into a strong cycle - end of the year when holiday season starts and into the new year. We do expect to see some pullback from this big move, but move to new highs is still in the cards. With the Fed staying put on interest rates, we do not expect any type of major pullback in the markets. The Fed will not raise rates till next year - and that will drive the markets' direction. With no other avenues to make good returns, investors have no choice but to put the money into markets and now the BOJ announced a round of stimulus to put money into stocks - that just gives the markets more impetus to move higher. Pockets of strength still exits and we need to take advantage of these.
We are looking to the following sectors and stocks next week. Oil and energy stocks/ETFs, gold miners for short term trades.
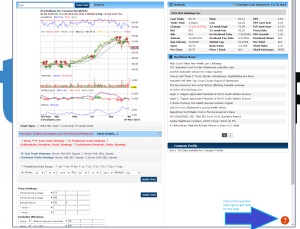
We have added a very helpful feature on our site to help and assist our users on how to use each page and a description of each field on the page. Please check this image below for this feature - it is on each page of our site now (except home page which is under re-design).
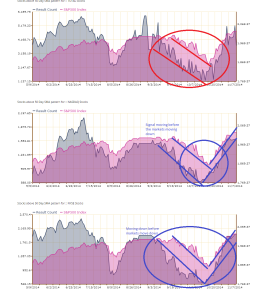
Here we wanted to show below how the sentiment charts from our site predicted this massive move up and the correction we experienced 3-4 weeks ago in the markets - note the drop in the stocks above 50d SMA before the markets actually went down and then the rise in stocks above 50d SMA before the move up in the markets. The signals are very clear prior to the market moves - we have highlighted these with the trend lines. You can see clearly that we are at a top and a sideways market for the next few weeks and possible pullback prior to thanksgiving. As you can see the stocks above 50d SMA is moving down and we are in a topping mode for the markets. We have several such indicators for all the reports we generate on our reports page:
Here is our list of stocks to watch for the coming week:
Buy SIgnal: www.trucharts.com/stockview.aspx?TICK=XOP
www.trucharts.com/stockview.aspx?TICK=NSC
www.trucharts.com/stockview.aspx?TICK=TGT
www.trucharts.com/stockview.aspx?TICK=DO (watch)
www.trucharts.com/stockview.aspx?TICK=ETP
www.trucharts.com/stockview.aspx?TICK=CNQ (short term trade)
Good luck trading.
Here is the udpate from our hedge fund manager for his performance from last week (cumulative return for a $50000 account):


No comments:
Post a Comment