Go Daddy Signup

Showing posts with label Stock Market. Show all posts

October 19, 2017

Bubbles everywhere and new highs and extreme complacency


Bubbles, Bubbles and more of it...


This is what bubbles of made of - low levels of volatility and no respect for risk. We are now in a massive bubble and it is now looking like it may also beat the 2000 bubble. All around me I see people discussing stocks and trying to make that quick buck and let me tell you in this type of environment it is very easy to do that. Extreme liquidity from all central banks and the Yellen, Draghi put is making this market look even more risky day by day. But right now everyone is high and happy - as every investor thinks that stocks will never ever go down and there is no risk. Stocks like IBM, UNH and big cap names moving over 10% in a day is not a normal market. Stock rebounding on bad news is not a normal market. All news is good news, even if it is manipulated from an earnings perspective. All valuation metrics are above and beyond the previous bubbles and we have literally created money out of thin air. Central bank balance sheets are loaded with debt instruments, company valuations from a Price/Sales and PE ratios are at highs that eclipse the previous bubbles. There is total disregard for risk and yet no one cares - everyone acts like this is normal price action. Take for example IBM - they beat earnings because of their tax rate - and their tax rate - a phenomenal 11% - yes you read that right - a company as big as IBM pays a 11% effective tax rate and us normal folks pay at 30%. Their revenue was marginally higher and yet the stock was up over 10% in a day - think about it IBM up over 10% in a day. ADBE reported numbers that were slightly higher than the analyst estimates for 2018 and the stock jumped over $15 in after hours - yes that is right over 10% move in a single day. Yet we have the TV talking heads all acting like this is normal and there is no bubble. We do, my friends, and I have lived through two of these and this is the 3rd one - but this is not only a stock bubble it is like a loaded gun - completely leveraged - with housing, stocks, debt, and bonds all at all time highs and we are supposed to act like this is normal. 

Our good old friend Masayoshi from Japan is back and making the rounds - he lost over 70B in the last bubble - yet people gave him money again and he is running around like a boy in a toy store making stupid investments in companies that will never survive and at valuations that are mind blowing. He has a 100B fund. Think about that 100B to invest anyway he wants with no restrictions. Exactly like 1999-2000.

Everyone is feeling rich and the rich just got a lot more richer. More billionaires everyday - why? - all because the Fed is a puppet to the banks and the markets. Foot on the pedal on money printing. They dare not touch the dial or the button - who knows what will happen if they cease or pull back on their asset purchase programs or take away the punch bowl. They are petrified and have no handle on the situation - they use outdated metrics to measure inflation so that can keep printing more money and to keep juicing the pump.. We are all at a big party and no one thinks it is going to end - end it will - when maybe next year - I think. But until then just keep drinking...and get drunk.

Margin debt is at all time highs and yet no one is worried - the last time that happened was at the market tops of 2000 and 2007.

Some articles to read:

http://www.zerohedge.com/news/2017-10-18/long-list-market-anomalies-what-look-if-indeed-major-bubble

http://www.zerohedge.com/news/2017-10-18/something-wicked-way-comes-mcdonalds-–-bear-bull-costume

http://www.zerohedge.com/news/2017-10-18/when-not-if

http://www.zerohedge.com/news/2017-10-17/bubble-nomics

It is a bubble when you no longer have to flip homes to make money - you just have to take a snap (photo) and send it to an investor and just make money (check SnapFlip). Boy times have changed but the story has not. It is the same - wash, rinse and repeat (just with different names). Every show on TV now is related to housing flips and everyone is in it. Amazing how things look the same once you have experienced it before - what is that called - oh - 'deja-vu'. The more they say it is different this time, the more convinced I am that we are in this huge bubble and something is about to break. When who knows, but it will happen. Just read the articles in the links above. 

Margin debt at new highs, consumer credit card debt at new highs, auto loans at new highs, student loans debt at new highs - we are all running on borrowed time - we are a mind boggling debt creation machine and what is that called - enslavement. The rich have gotten richer and they are creating debt to enslave others. Companies are mired in debt and China - don't even talk about the Chinese regime - they are lying about everything - just to keep up the charade - debt is ballooning in China and is at over 250% of GDP and everyone says - that's OK - they will manage - of course, I could manage a trillion dollars as long as I have dollar printing machine in my back yard. 

It is amazing to see what is happening and everyone is smiling and acting like - there is no problem - it is all glorious.. Sure it is.. IPOs left and right, mind numbing valuations for startups with no revenue and so many stupid companies being funded - it just rings bells of 1999-2000. I think there must be a 17 year cycle or something..Anyway keep your eyes wide open, and learn to take money off the table and take profits.

We have a very unique feature on our platform - we call it PortfolioSense - as a subscriber you can enter any number of portfolios and we will send you an email at the end of the day to show how your stocks are doing in terms of the technical signals related to the holding in your portfolio. You can then check out the chart to see if you need to make a buy or sell decision. Check it out - I use it all the time and here is the link - http://www.trucharts.com/TransactionDetails.aspx

Don't even get me started on the Drumpf..


April 26, 2015

We made over 18% in three weeks? What did you trade?

Trucharts.com Blog week ending 4/24/2015

Free Stock Chart(s), Technical Screener, MACD Charts, Scanner, Real Time Stock News, Stock Patterns, Stock Quotes, Portfolio Management, Earnings Calendar and more:

Well the stock markets have been going through a nice up trend with this earnings season in full force. Stocks in many sectors were rocking and not so in some sectors. The technology semiconductor sector looks like it has topped out in earnings - check how AVGO, NXPI, TXN (reported earnings and tanked) and many others are pointing to a slowdown in this sector. We were short SMH and recommending shorting NXPI and AVGO in our last blog. We would stay short SMH.

In addition, next week we have the moment of the quarter earnings from AAPL on Monday and then TWTR on the 29th (and BIDU also). FB (Facebook) earnings did not look strong and we still do not like FB due to its valuation. Google stock moved, primarily due to short covering. AMZN was a blowout - unfortunately we think here it is expensive here - even though it may move higher. The earnings will keep going this week and you can check the earnings calendar for your stock on our stockview page in the data box and on our earnings calendar page at: Earnings Calendar.

Here is a stock we talked about shorting and looks like a great candidate for short - please always hedge your position by buying an out of the money call. We always hedge our positions. Stock is IPGP and here is the chart:


Stock is closed below 13d and 50d SMA - target would be 85 and below.


Gold got killed last week but we think this is going to be range bound from $1100 to $1200 and we will keep a close eye on this. Some commodity stocks did well this past week - check out RS, VALE.

Markets are still trending higher - we think there is a chance for a breakout here and we have to see if there is follow through. Chinese markets are on a roll - bubble brewing but not over yet.

Now how did we make 18% - we traded TWTR stock - TWTR has been range bound between 49 and 53 and we bought the stock for 3 weeks in a row and wrote the covered calls for each of those weeks, since TWTR has weekly options. We traded 400 share blocks and our investment was $10000 and our net profit was $1800. Total return - 18%. We are still long TWTR and plan to stay long into earnings - we think TWTR is beating FB (facebook) and is growing now. We will write covered calls for next week May 1st - Friday for part of our position.  Anyway - I wil be traveling this week and will still try to publish and update the blog next weekend. Check out our site for excellent real time stock news and excellent features like mouseover charts/automated buy and sell signals for any stock which you will find on no other sites. We charge the lowest subscription fee for full access to our site. We need your support and we have been providing actual trades and the best picks for the last 6 months - all for free.

March 18, 2015

Bought these hot stocks today - Markets Rally today

Market Rally 3/18/2018 - Thanks Ms Yellen - Greatly appreciated 

CORRECTED LINKS..IN THIS UDPATE..

Well today's Fed output (scientific term) was all but nonsense and as expected - the markets had done a classic bear trap and sucked everybody in. Our expectation was to stay net long and our picks from our blog this past week was right on the money - Euro rallied, Gold rallied, Oil rallied and the Fed will keep blowing bubbles till it learns a lesson it will never forget - till then keep partying.


We mentioned the XLU, SO, PCG, LLY and BIDU in our blog this past week and as part of our holdings - all of these stocks rallied hard today - staying long and going long more on BIDU or LLY..


Here are the charts:


www.trucharts.com/stockview.aspx?TICK=LLY


www.trucharts.com/stockview.aspx?TICK=BIDU


www.trucharts.com/stockview.aspx?TICK=XLU


www.trucharts.com/stockview.aspx?TICK=SO


www.trucharts.com/stockview.aspx?TICK=PCG


Good luck trading. 


Founder/CEO

Trucharts.com

March 16, 2015

Weekly Stock Blog 03/13/15 - Stocks to Watch and some good reads - Trucharts.com

Trucharts.com - Weekly Blog ending 03/13/15 - Good reads and Hot Stocks to watch

Sorry for the late posting - had some family obligations to tend to. 

What an amazing week in the markets - very volatile moves up and down - sounds like a roller coaster to me. We stated in our previous blog that the range would be between 2080 and 2050 for the SP500 and that is what we saw this past week. The markets rallied today and the resistance in the SP500 was expected to be 2080 and the DOW resistance around 18000 which is right at the 13d moving average. We will have to wait and see if the markets can break above this range now or will it consolidate or see a breakdown. 

With the BIGGEST news this week expected to be the Fed view on future interest rates - this is expected on Wednesday - economists are split evenly on what the Fed will do and we think that the Fed will stay put on rates till Fall or September knowing that the inflation pressures are muted due to the fall in oil prices. With the strong dollar and negative rates in the Eurozone, we do not see how the Fed will move to raise rates - the only concern on the Fed's mind will be asset bubbles in real estate and stocks. 

Here are some very good articles and reads for Fed interest rates:
Markets rallied today due to the USD pulling back from an extended move up - but we still like the USD - euro is headed lower and we think this may be a short term pullback into a bullish move in the USD. Again, we would expect to see a move after the Fed's comment on Wednesday on interest rates.

Let us take a look at some of the commodities - oil hit a new low today and is heading to our target price of $40 - the oil stocks bounced today - maybe a sign of some bottom in the oil sector - especially knowing that we are heading into the summer season. Keep an eye on the oil sector stocks.

We are long USO and short the calls against our position.

Gold is languishing here pending the Fed's view on rates and is still looking weak. Wait and watch.

We have been watching the Utilities sector stocks (XLU - ETF) as this sector has corrected over 20% due to the move up in yields and move down in bonds, and the move up in USD. We discussed this sector over the weekend in our meetup and pointed to stocks as (www.trucharts.com/stockview.aspx?TICK=SO), and (www.trucharts.com/stockview.aspx?TICK=PCG) - these moved up over 2% today. XLU is looking strong at the close of markets today.

We went long SO today and are long BIDU, USO, TWTR, BOX, Z, ANGI and LLY.  We are short UAL. Looking to go long AMGN.

The pharmaceutical sector - especially the BIOTECH sector took off again today - due to news from AMGN and Sanofi on the cholesterol drug findings - http://www.marketwatch.com/story/amgen-other-drug-company-shares-jump-on-cholesterol-drug-findings-2015-03-16?siteid=yhoof2. AMGN closed strong today and we like the stock. BMY broke out and LLY is also looking strong. Here are the charts:

AMGN stock chart
BMY Stock Chart

The tech sector looks interesting - we are very concerned after the INTC (www.trucharts.com/stockview.aspx?TICK=INTC) news of a lower revenue forecast. 

We expect that MSFT will also be impacted by this news as will the component suppliers to the the PC sector. There are some stocks that look very extended - NXPI, AVGO and SWKS.

Here are some other articles for reading:


Good luck trading.


Trucharts team


February 15, 2015

Trucharts.com Blog - week ending 2/13/2015 and Stocks to Watch

Trucharts.com Blog week ending 2/13/2015

Happy Valentine’s day to all and after a short travel hiatus, we are back to writing our blog. Due to blogging restrictions in China, we were unable to post to our G+, FB and blogger/WP. It feels weird when you cannot blog about just something simple as stocks. Anyway, it has been an exciting week after what we call a consolidation period in the markets. The S&P,NASDAQ and the DOW all hit an all time high – we were expecting the breakout based on the wedge pattern/descending triangle pattern that started in Nov. We expect this to move to last based on the recent earnings and the oil sector bouncing back. Gold pulled back and we expect gold to move down – we think the move up was due to the Chinese New Year. The Greek crisis is just noise and we do not expect this to impact the markets. Oil is in a bottoming phase and we will watch this closely – our picks LINE, USO and OIL jumped very nicely (over 30% for LINE and OIL etf), our GM short and F short will be rolled over to next month. We expect this to be a peak year for auto sales. Our pick CYBR did very well as did TWTR – both of these are up over 40% CYBR and 20% TWTR since our calls and check out the buy signal for CYBR on our buy/sell strategy chart below:

Check the Chaikin money flow Index on the bottom of the chart – it went negative when the stock gapped up on Friday. Based on our technical analysis, we would expect the stock to pull back/consolidate and make a move higher. The earnings were announced on Thursday after the close and the company crushed the earnings and guided higher.
CYBR Stock Chart

CYBR _ WITH BUY/SELL SIGNALS

TWTR also reported good earnings and that moved higher and we are still expecting a move higher in TWTR. 

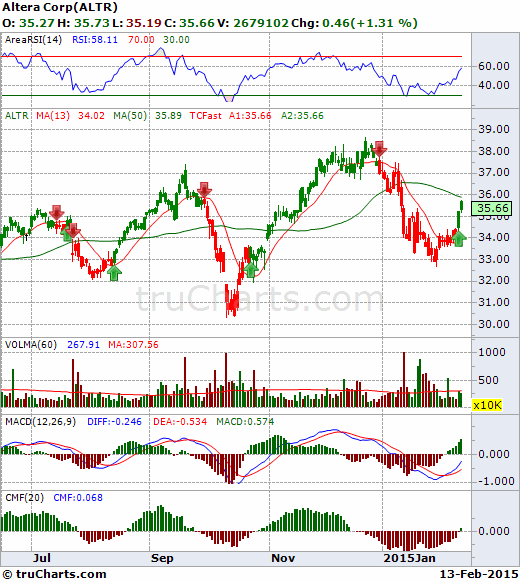
We went long ALTR based on the technicals. Here is the chart for ALTR. We will exit the position this week around 36.25 or better.

ALTR Stock Chart
We went long AMKR, are long USO/LINE and are watching the following stocks closely next week:

http://www.trucharts.com/stockview.aspx?TICK=VFC (which went buy signal right before the gap up)
Markets are closed for President’s day – Monday. Good luck trading and check out our multiple charts feature and also our real time categorized news feature.

We closed our position in K (Kellogg) right before it gapped down on Friday – looks like people are not eating enough cereal!!

Our call on DAL short was right on the money - we closed that position this week.

Trucharts Founder

January 25, 2015

Trucharts.com Hot Stocks and Stocks to watch - Weekly Blog update - week ending 1/23/2015

Trucharts.com Weekly Blog update - week ending 1/23/2015


A shortened week and the Draghi moment on Thursday when the markets were up nicely after another round of QE was announced 1 Trillion Euros – all central banks are printing money and there is no stopping – low interest rates (negative in the Eurozone) and then we have stock bubbles and ZIRP in US is showing up as bubbles in stock valuations and real estate. We do not expect the Fed to do anything this year on the Fed Funds rate and Draghi is bent on destroying the Euro (which incidentally is at 1.115 to the USD) – now European vacations are going to be lot cheaper. And then we had the Greek election and the drum roll please !!! – the anti austerity party won the elections – what a surprise!! Are the Greeks going back to the drachma??
Enough politics – what does this do to the markets – the move up on Thursday was a big move and the move down on Friday looked like a consolidation move and the trend is still intact – the RSI and MACD is moving higher and we think oil is vacillating within a tight range, and gold is also consolidating. Keep an eye on gold and oil. There are over 1300 companies reporting earnings this week. AAPL is on top of the list and as are many big names. Check out the earnings calendar on our site at:http://www.trucharts.com/earningsview.aspx and also we provide the earnings date for any stock on the stock charts page. Futures are pointing to a lower open, but we expect the AAPL earnings maybe the catalyst and Fed speak is what is going to drive the markets.
We are short GM, F, IBB, DAL (sold some puts also)  and long USO, WSM, K, CYBR, LINE and went long BOX on Friday. Our ALTR short was a good call and GM calls expired. Our Trucharts.com BUY/SELL strategies are working well and we are using these to make trade decisions along with watching the technicals closely. There will be a lot of noise during the earnings season, so be watchful. Here are some stocks we like: K, and the list below – futures are down this morning – so be careful with your entry and keep tight stops – the trend is still up and we think until the Fed speaks we may see some volatility.
BABA104.0200105.2000103.0200103.1100104.00009847987
CME88.500088.940087.680088.510088.57001058695
EBAY56.990057.280056.310056.760057.150013357022
ETFC23.900024.970023.780024.560022.650012271579
EXPE84.330088.650084.140087.440085.71003679708
HON101.1100103.9200100.5000102.410099.39005209857
HPQ39.960040.250039.760040.100040.06006171057
IWM118.3400118.7700117.5500118.1300118.200026223219
MNKD5.59005.80005.51005.74005.57004143225
NOW66.590069.500066.550068.740066.14001015475
SNPS43.200043.850042.900043.530043.1700448589
VLO48.150050.900047.740050.160048.000011559865
Check our Reports section for many other picks in the MACD bullish crossover reports and others.
Please spread the word and invite your friends to use the site and take advantage of out recommendations and site features.
Trucharts CEO and Founder
Bob Bhatia

January 13, 2015

What a day!!! - closing remarks 1/13/2014

Well it sure felt like Friday the 13th today. Markets were up and then pulled back completely. We think it was a bull trap and people are very concerned about the upcoming earnings reports and forward guidance. With oil dropping and the commodity sector (at least for now except gold) falling - looks like there maybe some rough riding here. These type of moves happen when there is tug of war between the bears and the bulls. TIF (Tiffany got massacred yesterday) - Crappy stock SNDK got killed - they were getting the benefit of a bull market and we think the semiconductor run maybe over. Please take profits in this sector until the 2nd half of the year comes around. Technically, today was a bearish day - see chart below for DIA and SPY. You will see lower RSI , lower MACD and the DIA/SPY closed 50d SMA. ALmost looks like a bearish wedge pattern.

We think oil has reached the bottom of its range - we will watch it here carefully and try to establish a position in USO.

We hope to see some good results from the retailers - we will keep an eye on that.
We will close our ABBV position tomorrow - should have closed it today.

We are long AMKR,WSM,K,CYBR,USO and LINE. Short GM,F,AEM,DAL,IBB. We always hedge our portfolio with options and not be all long or all short.


Check out our site and you can clearly see our auto buy/sell signals for your stocks.
GPRO and MU were on the sell signal list 4-5 days ago.

Trucharts team

December 21, 2014

TruCharts.com – Free Stock Charts – Blog week ending 12/19/2014

Trucharts.com Blog week ending 12/19/2014

For SEO: Trucharts.com – Stock Charts Free, Stock Market, Stocks, Charting, Dividend Stocks, World Markets, Technical Analysis, Market Sentiment Charts
Merry Xmas and happy holidays to all. We are in a short week of trading this week and the fireworks were on last week after Fed Speak. We did not expect any surprises from the Fed on the raising of the Fed Funds rate, and the Fed made it a point to tell the markets that it was still ok to take risks and that drove the markets to recover over a 800 points on the DOW and 100 points on the SP500. A lot of this was driven by energy stocks and since some of the stocks had dropped over 50% – there were short covering rallies and bottom fishing and a major short squeeze. BofA Merrill Lynch downgraded several semi stocks but these did not correct as much. The SP500 and DOW look like they are still in an uptrend and our indicators are still showing a trend for the markets to mover higher – after a short consolidation period. The move this past week was massive, but the volumes in some stocks was not high. 
We like XLU (www.trucharts.com/stockview.aspx?TICK=XLU) and the utility stocks as good dividend earners. Check out the charts for SO, ED, PCG and DUK. Even the REIT’s look good and some consumer staple stocks look good. We took a position in K or Kellog (www.trucharts.com/stockview.aspx?TICK=K) and USO – we believe this has finally bottomed for the short term. Keep an eye on CAT (www.trucharts.com/stockview.aspx?TICK=CAT) – we are looking to take a position in CAT. 
We have been hurt by our short position in IBB – but have been writing puts to improve our short price. Our other positions are doing OK – Long WSM, short YHOO (plan to close Monday), DAL, AEM. We are looking to go long CYBR.
There is definitely a XMAS rally going on and we expect this to last into the New Year – until the earnings season starts. AAPL (www.trucharts.com/stockview.aspx?TICK=AAPL) still looks good technically.
We added some new features to our site this week – execiting stuff:
1. MULTIPLE SYMBOL CHARTS on one page – check this feature out at: http://www.trucharts.com/multiplestockcharts.aspx
2. ICHIMOKU cloud indicator on our stockview page and turtle trade indicator
3. Added borders to our charts
Check the features out and also our page: http://truchartscom.blogspot.com/p/why-is-trucharts.html
In addition, we want everyone to take advantage of avoiding monthly recurring fees  and sign up NOW for one very low annual membership for full access for just $90/year – a 50% discount to the annual membership fees and this gives you real time categorized news and complete access to all of the site including dividend stocks etc.
Again – Best wishes for the holidays to all and a Happy New Year and good luck trading.

TruCharts Team

December 19, 2014

Trucharts.com pick updated

Trucharts.com TUBE pick updated:


Check our pick from 3 weeks ago - it is up to $22 - we picked it at 14.

Here is the chart with our buy/sell strategy:


We went long USO and K today for short term trades. We will close YHOO short next week. Our IBB short is hurting but we have been writing puts against this short to raise our short price. We expect markets to move higher into the New Year. DOW 18K and SP500 to 2100+ is going to happen. 

trucharts team 

December 16, 2014

Stock to watch - Markets update 12/16/2014

Stock Charts Free/Scans/Stock Screener at Trucharts.com:

We have been saying stay short or exit positions and take profits. We are still short IBB, YHOO and DAL. Long BIS, WSM. We expect gold to go down further. Russia may take drastic action because of the currency plunge.

Check out the charts for the following:

www.trucharts.com/stockview.aspx?TICK=REGN

www.trucharts.com/stockview.aspx?TICK=DAL

www.trucharts.com/stockview.aspx?TICK=BIIB

www.trucharts.com/stockview.aspx?TICK=IBB

www.trucharts.com/stockview.aspx?TICK=YHOO


December 15, 2014

Brief Update on Markets 12/15/2014


Free Stock Charts/Scans/Stock Screener at Trucharts.com - 


We talked about gold pulling back and being short IBB - both of these are moving down and the commodity complex breakdown is going to affect gold and gold miners. Russian ruble has completely crashed and is now worse than the Indian Rupee. Amazing what US political power can do. Short AEM, GM and IBB, long BIS and WSM.


Markets were up and everyone was getting excited this morning. Then we had a pullback and we need to wait and see if the markets consolidate here.

Trucharts team

December 12, 2014

Trucharts.com - Markets Update and stocks to Watch 12/12

Free Stock Charts/Scans/Stock Screener at Trucharts.com:

Markets down today - check out our published chart for SPY - we stated trend was down and we are seeing that manifested in the markets today. Yesterday was a short squeeze and today we are headed to 2000 on the S&P.

Stocks to watch: ADBE, RH - for coming week.  Short DAL, YHOO, AEM and IBB.

This is what our elected officials are doing in the United States of America - watch out for your future and we elected these folks to represent the common man - unbelievable..


December 11, 2014

Trucharts.com Markets update 12/11


Free Stock Charts/Scans/Stock Screener at Trucharts.com: 12/11


Well we had huge ramp this morning - we suspect this was huge short squeeze which led to short covering. The trend is still to the 50d SMA. Oil crashed and gold pulled back. RH stock earnings drove up the retailiers and their forecast was positive. So WSM (we are long) moved up and our shorts are still holding. There was pullback towards the end of the day and the ISEE closed at 54 - one of the lowest readings in the longest time. Watch the 50d SMA for SPY. Markets are trading very technically. Fundamentals are just an excuse now. Bubbles are made of volatility, no fundamentals and lot of big moves in the markets while bears and bulls try to fight it out. We think oil should stabilize in the 55-60 range. Still holding all our positions. We hope there is now a revolt against the airlines for baggage fees - now that oil is down - they should no longer be charging these fees.


Chart for RH at:

www.trucharts.com/stockview.aspx?TICK=RH

Trucharts team

December 10, 2014

Markets Update 12/10/2014

Markets Update 12/10:

Markets down, oil down, gold down and our short positions are right on the money. We have been saying markets look extended here and the commodity crash will impact the markets. We have been short DAL, YHOO, ALTR, AEM and long BIS, WSM, CYBR. We think the markets will test the 50d moving average. GM still looks like a good short.


Watch this closely - HYG - correlates to market performance and trend.

December 7, 2014

Trucharts.com Blog and stocks to watch - Week ending 12/5/2014

Trucharts.com - Blog update and Stocks to watch:

Another week and another set of new records and new highs. There is no stopping this train. Excellent jobs report (321K new jobs created). Oil dropped this week and so did the commodities. Energy stocks are getting slammed and so are commodity stocks. We think there maybe an end coming to the commodity cycle - many have indicated that this is typically a 15 year cycle that started in 2000 and will end by 2015. This will impact commodity stocks - so if you have commodity stocks in your portfolio - like FCX, BHP, RIO - be mindful and this end to the commodity cycle may impact the dividends being paid out by the commodity stocks. Another concern recently has been the drop in the oil sector stocks and their issuance of junk bonds to fund their exploration - the main concern is related to the capability of these companies to pay back this debt due to the drop in oil prices (check JNK). Financial stocks are breaking out. We are watching BAC (Bank of America) - here is the chart (weekly) - looks like it is going to breakout (Other stocks to watch in this sector - financial - JPM, XLF, MS, ETFC, AMTD)
Stock Chart BAC


Gold is still holding between 1100 - 1200 - watching this closely - we still think this is headed to 1000.
Health stocks and airline stocks were hitting new highs this week along with many tech stocks. AVGOMCHP, SYNA and SLAB announced better outlooks for the coming quarter. We like the chart of SLAB - here is the chart (check the MACD and RSI):
Stock Chart SLAB


Right now the trend is your friend and the don't fight the Fed. We will look to go long the financial stocks this week. Keep and eye on the commodity stocks.
We are still heading into the holidays and a strong period of the year for the markets - we would expect some consolidation - but DOW 18K is imminent and as is SP500 hitting 2100. We are short AEM, IBB (hurting right now), YHOO (will likely close this tomorrow and go long BAC). Watching the stocks above and UTX.
Good luck trading.
Trucharts team