Go Daddy Signup

Showing posts with label Blog. Show all posts

March 16, 2020

Markets Panic amid the corona virus

Markets Panic amid the corona virus


Well, since our last post, markets have gone even further down and have pretty much wiped out the whole Trump elections gains in a matter of two weeks.  We have been warning of bubbles and valuations being absolutely out of control and now reality is starting to come into focus. We suspect margin calls are also exacerbating the selling  We were short and were long some puts and took on some longs today.. Two of our accounts was in an all cash position. 

Still there is risk and we are waiting for some of our indicators to show when buying is safe. The bottom is not in yet and you may see some wild rallies - do not buy - but only use these to unload or do intraday trading - there is lot of money to be made here.. We will see a bottom and it will be very obvious once it arrives and the pent up demand will be huge... So be ready.

if you have not taken profits in stocks that are making money like AMZN, AAPL and MSFT along with FB, NFLX - we highly recommend taking profits.. These stocks have not reached a bottom yet even with the intermediate rallies.. Check out our tweets @trucharts and check out some of the charts we post during the week. We have been short AAPL, SHOP and ROKU.. We closed our ROKU position today.. 

Again - we recommend doing intraday trading and using options to collect and get good premiums. The bottom is not in yet as much as it may appear from the oversold conditions and the VIX.. We may see a short term rally here - but use these to sell.. 

Good luck trading..

Check out our site - for excellent real time charts, quotes and fundamental data along with our excellent screener..

B. Bhatia
Founder Trucharts.com

January 6, 2019

Schizophrenic markets, Fed Reserve, Powell and markets moving up, FAANG stocks

Schizophrenic markets, Fed  Reserve, Powell and markets moving up, FAANG stocks

Well the man with balls - lost them over Xmas and New Year's eve - you know who we are talking about - none other than good old Powell himself.. I guess he had a good chat with grandma Yellen and good old bubble maker Bernanke himself and suddenly had his balls chopped off for being too aggressive and making the rich poor - oh we feel for the rich!!! What a fucking joke. Markets gyrating 1000 points in a day, 700 points - guess we have to get used to these type of moves. And then we have the blabber heads on TV trying to explain these markets. And non stop talk about the Fed and their constant analysis - just annoying - it would be nice to have a channel where no one says anything. Yet have you heard anyone yet mentioning that the bubble is falling apart. Somehow the Fed roll off the balance sheet is now being questioned after the teachers of Powell (Yellen/Bernanke) made some noise on Friday and everyone was excited. Again we are coming off very oversold conditions and several stocks are bouncing of key moving averages. We like any stock here for the short term - normally all stocks in the indices will move with the move up. so the FAANG stocks are also good for the ride up. Banking stocks look strong on charts - again be mindful - we are talking about some short term moves here and these can be used to trade intra-day and for overnight positions. Obvious names come to mind - FB, GOOG, SHOP, GRUB, NFLX (which moved up and we think it is going to 300). There are many other heavily shorted stocks that also have high betas.

Here is an article worth reading:
https://www.zerohedge.com/news/2019-01-06/ugly-truth-you-wont-hear-fed

The AAPL news was expected - it was obvious based on the suppliers indicating that their biggest customer (as if this was a big secret) was canceling orders - so the news from AAPL should not have shocked anyone and it was also obvious when the stock started falling after the last earnings report. As expected the stocks dropped and the once darling of Wall Street lost a total of over 350B in market cap value - that is the whole market cap for FB - and we say the markets are not over-valued or expensive - this is actually happening - everyone is in equities and the ETFs do not help - we think ETFs should be banned - these distort markets and are really another way for Wall St to just make more money. How are these different from mutual funds - there is really no difference.

AAPL will need to change its approach on the next generation phones and there is nothing new on the horizon and specially this paying $1000 for a phone days are over. These companies need to start realizing that after a certain point - (same as computers) - people are not going to pay up for small feature improvements and there is a lot of competition in this space. Competitive phones are cheaper and better. A good phone should be no more than 500 - yet all these companies keep pricing themselves out of the markets. As you can see Samsung and AAPL are losing market share to Chinese competitors all around the world and we expect that prices will trend downwards as we may have reached the peak with IPHONE X.

There will be backlash as ordinary customers will stop paying these high prices being pushed onto them. This is going to be the next computer - lots of competition and prices will start to come down. There is a lot of buzz around 5G - we expect some noise around this - but it will be short lived. Prices will not be going any higher from here on forward. This means it will impact margins not just for AAPL, Samsung and others - but also their downline suppliers - they will be put under pressure on component pricing.

We would trade the markets here as earnings season is upon us - watch the man without the balls now - Powell - who changes his tune every couple of weeks. He is like a management trainee..

We are expecting to launch our new revamped site with new features and buy/sell directly from our site towards the end of Jan - slight delay to our original planned date.

Time to go and make some money.. Good luck trading.

HAPPY NEW YEAR 2019..

Trucharts team/Founder (Co-founder Jetstox.com)

July 13, 2017

Fed testimony, Markets, Tech Stocks and Backtest feature on our site


Fed testimony, Markets, Tech Stocks and Backtest feature on our site


LATEST UPDATE: Yellen dovishness sparked huge market move and tech stocks came off oversold conditions. Revenue growth is not there - but we are in bubble mode. We like the following pair trade - Long NFLX calls, Short NVDA. VIX is at all time low and volume in markets is also low - therefore the grind higher. Keep tight trailing stops. SP500 is going to 2500 and DOW to 22000. No stopping this bubble - we like also KLAC and AMAT. BA was our top pick and we still like it.

Brief update on the markets and Yellen testimony. 

Well looks like the squirrel went back into its hole - Yellen and the central bankers are now clueless as to what to do - one moment they are hawkish and then the next two weeks they become dovish. They are so scared now to raise rates, that they have just completely given up. They talked about reigning in the monetary stimulus via draining liquidity from the system by selling their assets on their huge balance sheet of over $4T - loaded with mortgage backed securities. They want to start this in September and increase that as they go along. In addition, Grandma Yellen also indicated that she may not be raising rates (of course that would increase our debt burden) T aggressively - the markets rocked up in a straight line, dollar crashed but gold was up slightly. Basically the Fed is saying we do not care about the bubbles, asset valuations and whatever else the loose monetary policy has unleashed in asset bubbles around the world. Case in example - do you know that the Indian stock market is up over 1000% - yes 1000% - in 14 years - no one is mentioning that the Indian banks are drowning in NPLs - but yet the market is up over 1000%. PEs and company valuations in the US are at levels not seen since the 2000 and 2007 heights and moving higher. But the central banks do not care as this is making the rich richer and the goal is to make the average guy feel richer. Nasdaq is out performing and we are heading into earnings season for Q2 - we will have to wait and see how the companies manipulate their results using financial engineering and stock buybacks etc. Oil has been crashing - we had predicted that and we will have to wait and see how that plays out. Tech stocks are rocking and rolling like there is no bound to valuations and PEs - sounds like the 1999-2000 bubble times (i remember those days very distinctly). FAANG stocks are rocking and we like NFLX and AMZN. FB is breaking out and we need to watch carefully where it goes. We like BABA, QCOM, BA, CAT, LLY, AAPL and are short NVDA. Airline stocks like UAL are about to breakout and rail stocks along with defense stocks look good. Even though there may be issues with the valuations etc., these do not matter as we are in full bubble mode - in Bay area people are over bidding on houses by over 350K with multiple offers - exactly like 1999. We expect this to continue. In addition, we are not seeing any real technical weakness in the markets other retail and oil stocks. We also like EEM as merging markets are doing well.

Always put a stop limit loss of 5% to 10% below 50d SMA to limit your loss or gains in case there is a crash. Check these values on weekly charts also - like 13 week and 20 week SMA.

Also spend your time to learn how to trade options - it helps to reduce and improve your portfolio risk and return.


There is a very unique feature on our site - call backtest and we use it for checking certain technical analysis parameters for many stocks to see which yield the best winning results. Here is an example for stock Facebook or FB and you can see one of our trading strategies generated a buy signal on 7/7 and the results showed that this was a very strong signal for FB and it yielded 7 winners and 1 losing trade. So there was a very high probability that the signal would yield to higher prices and sure enough the stock moved over $8 in 3 days to 159. See the snippet of the testing below:

It is tested over 600 trading bars and the results are amazing. We will be restricting use of this to paid subscribers only very soon and you have a chance to test it out. You can also check out our videos on youtube - links are on our site - www.trucharts.com.

Good luck trading.

June 12, 2017

Friday's Nasdaq Tech Bloodbath

Blog 6/10/2017 and 6/12/2017 

Trucharts.com


Was it a tech carnage or not?? Friday was a huge rollercoaster ride but we made out really well!Well, Friday started out like a good day in the markets with many of the FAANNG stocks hitting new highs and then reversing ending lower. AMZN moved around 100 points and we were very fortunate that we had closed our puts and were long the lower puts on many stocks and all of these made us some really good profits.We have been short NVDA and are staying short - we know this is a bubble stock trading at ridiculous valuations. Many of the stocks on the NASDAQ have been going up non stop in a straight line up with almost no end in sight - it looked and still looks like the bubble of 1999-2000 with a different feel. Everyone feels invincible and like a investment pro. It is all easy to think that one is a genius in investing when making money is so easy. It is days like Fridays when folks start getting margin calls that we see selling and then everyone tries ti buy the dip. We will have to wait and see if buying this dip makes sense. 

Now there was one key thing we had noticed on Thursday even when stocks were moving higher - MSFT was acting weak and that was a sign that something was changing. Everyone in the midea and online (CNBS - Cramer) has been harping on and on about NVDA - a chipmaker which momentarily reached a market cap of 100B - yes 100B and selling at price to sales ratio of around 12+ - no semiconductor company has ever traded at such a huge multiple or valuation. Also it is very common to see when stocks are high flying that analysts and idots on TV come out and try to justify the valuations of such stocks - vocalizing terms which they have no idea about like AI and VR etc. NVDA is a chip company - end oif story and their sales will never ever reach the lofty valuation it carries. NVDA is primarily a graphics chip company with lot of competition and this is a very hyped stock. We highly recommend taking profits, if long, and we are short and long NVDA puts.So what happened Friday tech stock bubble - we think there is a shakeout that took place. Technicals are still strong and until we actually see real technical breakdowns - we have to count it as a shakeout. In addition, it would be prudent to take some chips off the table and ring the bell on profits. Many of the stocks bounced up from their 20day and 50d SMAs. Very typical when machines are running the house. We can expect some bounce but we are also seeing rotation out of tech stocks, which we mentioned have been going up in straight line fashion, into energy and other sectors. 

Financials were strong but we still think this was a dead cat bounce. We like BAC and some financials, in energy we like beaten down names like SLB for short term plays. We also like some retail names - short term trades - GPS looks good. We would short SBUX, NVDA and LRCX. Although the real technical weakness or clear breakdown is not evident yet - have tight stops above at recent high. We suspect there will be some bounce back and maybe this was just a shakeout. We will have to wait and see confirmation - as there were no breakdowns below 50dSMA. NVDA was a classic textbook climax high reversal.

Financials were looking strong as these were oversold and oil bounced with gold closing lower. We need to watch for follow through on these next week. GPS chart looks good and we are watching BABA to see if it consolidates here for a breakout.Monday was a nice bounce back day. Many good formations on charts - need to watch closely - still short NVDA.Good luck trading and checkout our video on youtube and follow us on twitter (@trucharts). We will start posting more videos on youtube on how to use our site more effectively for trading decisions. Do subscribe - it is only $10 per month for full year subscription.

B. Bhatia
Founder - Trucharts.com

September 27, 2015

NASDAQ,DOW and SPY where are these headed? What to do with your portfolio? Trucharts Weekly Blog

Trucharts Weekly Blog

NASDAQ,DOW and SPY where are these headed? What to do with your portfolio?


Sorry that we were unable to publish our blog last weekend due to some family commitments. Well the Fed speech impact was short lived and then volatility picked up in the past week and the biggest standout was the biotech sector which had driven up the NASDAQ to its 2000 highs and everyone on TV was still bullish on biotech sector. As much as we like some stocks in the drug sector and the biotech sector, the valuations were not justified - in addition, we were seeing heavy insider selling in many companies. Many biotech companies with no revenues were showing exponential charts and if you recall how we warned about exponential charts - these always are a bad sign of things to come. Just check out some of the high flyers in the biotech sector. We were also seeing weakening technical signals in the ETF IBB when it was hitting new highs.


Check these stocks:

www.trucharts.com/stockview.aspx?TICK=BLUE
www.trucharts.com/stockview.aspx?TICK=ICPT

and then there are many more in this sector that would move on the smallest drug news. Absolutely ridiculous. We have been saying to keep and eye on the 50 week SMA for ETF IBB (which we have been short), and sure enough once it broke the line in the sand it cascaded down and now it is a pure short. We are stil short but we are long BIS (short ETF) which closed for the first time above 50 week SMA - here is a comparison chart (IBB vs BIS). Check the BIS volume - highest ever.

We also have the chart here for the buy/sell signals for IBB on weekly chart - see below (this feature is provided to our registered/subscribed users). We think IBB is headed to around 260 - 280 range. There will be margin calls on folks who are long biotech stocks.


Now where do we think the markets are headed - gold moved up after Godmother Yellen spoke on Thursday that rates would rise in 2015 and markets were up in on Friday early and then pulled back later in the afternoon. We believe the institutions are moving into the comfort of consumer cyclicals, staples and high divided yielding stocks in sectors that are still strong. We are concerned that we may see dividend cuts in the stocks of oil companies - just a guess - but with oil down - there is no way these companies can sustain such high payouts. In addition, we expect massive layoffs and the oil states economies will be affected (Texas, Louisiana and others). We like NKE after their earnings report. We hav been playing with NFLX and are short FIT/GPRO (valuation too high). We expect the DOW to stay range bound 15000 - 17000 for some time here, SPY is headed to around 1750 - current price is 192.85. We would be very careful here - SPY and DIA have broken 100 week SMA. 

China slowdown has now shown up in 2 major equipment suppliers - JOY and CAT. CHina is definitely slowing down and we have to see if they are headed the way of Japan. In addition, the central banks are still running loose with money printing and it seems to be helping the top 1% only. Brazil is going to the dogs with its credit rating cut. The rates for 10 year bonds in Brazil have shot up to 16% - want buy some Brazil debt - anyone? We would stay away from these stocks. We like gold stocks - but we need to see high volume breakout - we are not there yet. We encourage to write covered calls on your positions - that is what we have done and that has protected our portfolio. The trend is down. The ony thing in favor of the indices is the RSI is oversold - but needs to consolidate. Here is weekly chart for SPY:


Check out our site features at the best subscription rates in the industry and on the web:


Good luck trading.

Stay nimble.

Trucharts Team and Founder/CEO


July 9, 2015

Greece, Markets and Dow Jones below 200d SMA - Mid week update - Blog Trucharts.com Stock Blog

Mid Week Update - Trucharts.com Stock Blog - Will Grexit be a reality and stocks to trade and China stock markets

SEO stuff: 

Stock Charts Free - Trucharts.com - Technical Analysis, MACD, ETFs, Dividend stocks, Charting, Free Charts, Stock trading, Hot stocks, Trading Strategies:

What a week - sorry, we could not post over the weekend and then we had huge market movements in China, US and then the Greek referendum. 

China markets were down over 30% and the Chinese government made or passed laws to arrest folks who were aggressively short selling, then increased margin leverage, forced brokers to plead a measly 120B Yuan to buy stocks, banned companies from selling their own stock and I am not sure when this list will end. Well in response to all these wonderful government interventions, the markets rebounded yesterday to the tune of 200 points and everyone was getting excited. We are non-believers of this rally and think it will still take its own course eventually - we believe the China growth engine is slowing due to their shadow banking and debt problems of the state owned entities. We expect the Chinese GDP growth to drop to below the 7% number and the Chinese are very concerned. We stated that the world is mired in overcapacity and China is at the root of this overcapacity. We expect a slight bounce in the markets here, but the downtrend should resume - timing not clear. When you are minting a billionaire everyday, you will eventually have more billionaires than anywhere in the world... Bubbles, bubbles and more bubbles and the Chinese government does not know how to handle bubbles - amateurs. And they have been printing money non stop - this will come to haunt them someday.

Now Greece - well the referendum passed with an overwhelming NO to the Eurozone and it is not clear what the Grexit will look like - we believe the Eurozone members Germany and France are extremely concerned about the future of the Euro zone if they allow Greect to exit - this is called dismembering - if one falls will others follow - Italy, Spain, Portugal and who else!! That is the reason the Eurozone leaders are scrambling to prevent Greece from exiting - we still expect that this is inevitable.. 

US markets - We stated in our previous blogs that the markets were exhibiting topping action and sure enough we had the markets trying to hold levels of 18000 for the DOW, 2100 for the SP500 and the 5000 level for NASDAQ. This topping action was ongoing for 4-6 weeks with 3 digit moves every other day. Eventually the markets broke down and now the earnings season is in full bloom. Markets broke 200D SMA for DOW and we are closely watching the 17700 level now as resistance and 2070 for the SP500. VIX is elevated and we have to be on our toes. 

We had earnings report from Micron, which were lower than forecast and their outlook was grim. AMD re-enforced the slowdown in the PC markets and we expect the same from the overall semi sector. We stated to go short INTC or SMH and overvalued stocks such as AMBA, SWKS, NXPI and AVGO. We believe INTC buying ALTR was a desperate move from INTC and they paid a hefty premium for this. And as did AVGO buying BRCM for a hefty premium. There is no questions there is a major slowdown in this sector and we do not expect any major driver for this sector. Overcapacity is a definite issue and the phone markets are getting severely saturated in China and India.

Some good reads from this and the past week:


We are long BIDU,CYBR with covered calls written and short INTC,SWKS,AMBA. We went long WBA today for a short term trade. 

We recommend that you hedge your positions by buying some put protection and selling some covered calls. 

Check out some new features on our site and help us spread the word - we rely on word of mouth advertising - we focus our funds on driving development of our site. 

Here are some charts for DIA, SPY, and QQQ - weekly: 


Keep an eye on 50 week SMA for all the above symbols - these are critical support. In addition, watch IBB to see if it closes this week below 13 week SMA - if it does - it is ripe for a short.


Best of luck trading.
Trucharts team.

May 31, 2015

Markets Direction - Up or Down? Where are we headed? Trucharts.com Blog Update

Markets Direction - Up or Down? Where are we headed? Weekend Blog Update week ending 5/29/15

We have not had a chance to do a weekend update due to the jet lag from travel and other pressing matters. Finally getting some time to put my thoughts down related to the markets from the past 3 weeks and heading into the summer session.

Well NASDAQ hit a new high, markets moved higher and many earnings were reported. Avago bought Broadcom - a $37B acquisition (we think they paid too much - almost 5.5x sales) and then we have Intel buying ALTR this week - from an earnings we had HD, LOW and many other companies that reported earnings in the past couple of weeks. ULTA also reported but the stock reversed after reporting its earnings as did HD. There is talk of additional mergers in the semi company space - here are the companies that we think are ripe for consolidation - MXIM, IDTI, TXN, SLAB, MCHP, ADI, NVDA, AMD, SWKS, MRVL, XLNX, AMBA and probably many others we are missing.  Keep an eye on these stocks. NXPI, AVGO, INTC and other big semi companies would be possible acquirers. With the AVGO and BRCM merger - the merged company will be the 3rd largest semiconductor company after INTC (1) and QCOM (2).

Our drug stock picks LLY, MYL and TEVA still holding strong. The biotech sector has been holding the NASDAQ up and we expect that this sector will eventually fall - we just cannot predict when - there is technical weakness in the ETFs in the biotech sector.

We are very concerned about the underlying weakness in the markets - structurally. We are seeing many stocks breaking down in the DOW and S&P500. In addition, stocks are reversing after reporting earnings - check HD, ULTA. Housing stocks are dropping - indicating that the markets are anticipating rate hikes from the Fed. We think the Fed sees an asset bubble and are being left with no choice but to start raising the Fed funds rate. Housing prices are moving up. unemployment is down to 5.3%, homes on the west coast are selling at prices higher than asking - and this has been the longest period for the rates being at near zero - now close to 6+ years and over the past week we posted an article on FB and G+ where Byron Wein discusses how the Fed has pumped over $3T into the markets - we concur. And then we see this article over the weekend:

All these are pointing to over valuation in the markets and the complacency is remarkable. The VIX was down last week and we expect this to spike higher in the coming weeks. We stated that we would take profits here and hedge positions with calls and puts. Adding some shorts is in our plan for the coming week.  We are long BIDU, TWTR, Z (all hedged with covered calls) and are looking to short MSFT, and possibly IBM. 

Just take a look at the stocks that popped on our sell signal strategy here:Just sort the page by volume from highest to lowest by clicking on the volume column twice: 

Watch for our regular daily posts and positions updates on Twitter and FB.

Again - watch the Greek situation, China stock bubble, and sell here to take some profits and wait for a better opportunity.

Good luck trading. Check out our special subscription rates and we offer the best feature set on the web for our lowest subscription rates - here is the link: 

Do checkout our backtest feature - it is the fastest on the web and ummatched by any site.
Link is: Backtest feature - play with it and you can use it to try some paper trades.

Please help by spreading the word of our site.

Trucharts founder and team

May 9, 2015

Blogging restricted

To all our readers - Sorry we have not been able to update any of our blogs and other social feeds due to restrictions in China (due to our travel here). We will provide an update on the markets for the past week and stocks to watch for the coming week. Thank God Hong Kong is still freer than China - we will see how long that lasts.

Trucharts Founder/CEO

April 26, 2015

We made over 18% in three weeks? What did you trade?

Trucharts.com Blog week ending 4/24/2015

Free Stock Chart(s), Technical Screener, MACD Charts, Scanner, Real Time Stock News, Stock Patterns, Stock Quotes, Portfolio Management, Earnings Calendar and more:

Well the stock markets have been going through a nice up trend with this earnings season in full force. Stocks in many sectors were rocking and not so in some sectors. The technology semiconductor sector looks like it has topped out in earnings - check how AVGO, NXPI, TXN (reported earnings and tanked) and many others are pointing to a slowdown in this sector. We were short SMH and recommending shorting NXPI and AVGO in our last blog. We would stay short SMH.

In addition, next week we have the moment of the quarter earnings from AAPL on Monday and then TWTR on the 29th (and BIDU also). FB (Facebook) earnings did not look strong and we still do not like FB due to its valuation. Google stock moved, primarily due to short covering. AMZN was a blowout - unfortunately we think here it is expensive here - even though it may move higher. The earnings will keep going this week and you can check the earnings calendar for your stock on our stockview page in the data box and on our earnings calendar page at: Earnings Calendar.

Here is a stock we talked about shorting and looks like a great candidate for short - please always hedge your position by buying an out of the money call. We always hedge our positions. Stock is IPGP and here is the chart:


Stock is closed below 13d and 50d SMA - target would be 85 and below.


Gold got killed last week but we think this is going to be range bound from $1100 to $1200 and we will keep a close eye on this. Some commodity stocks did well this past week - check out RS, VALE.

Markets are still trending higher - we think there is a chance for a breakout here and we have to see if there is follow through. Chinese markets are on a roll - bubble brewing but not over yet.

Now how did we make 18% - we traded TWTR stock - TWTR has been range bound between 49 and 53 and we bought the stock for 3 weeks in a row and wrote the covered calls for each of those weeks, since TWTR has weekly options. We traded 400 share blocks and our investment was $10000 and our net profit was $1800. Total return - 18%. We are still long TWTR and plan to stay long into earnings - we think TWTR is beating FB (facebook) and is growing now. We will write covered calls for next week May 1st - Friday for part of our position.  Anyway - I wil be traveling this week and will still try to publish and update the blog next weekend. Check out our site for excellent real time stock news and excellent features like mouseover charts/automated buy and sell signals for any stock which you will find on no other sites. We charge the lowest subscription fee for full access to our site. We need your support and we have been providing actual trades and the best picks for the last 6 months - all for free.

April 16, 2015

Just Keep Buying; Just Keep Buying -

Trucharts.com - Mid week markets update:

SEO: BIDU stock, BIOTECH, Blog, Free Stock Charts, Hedge Fund update, Hot stocks, TWTR, MO, MACD charts

The markets are on edging on the verge of a breakout - and looks like now we have to catch up with the bubbles in China, India and Hong Kong - money printing eventually always leads to bubbles and all the central banks do not care - under the guise of slowing economies - money printing and 0% interest rates are driving an asset and stock bubble - the central banks will never admit it, even if it is staring it right in their faces - since they are scared shit to raise rates. This has led to property bubbles and stock bubbles - no one can tell now when this will end - but when it does - watch out below - this is totally unsustainable and complacency is becoming the norm - unbelievable. Bubbles after bubbles and the only folks making money from this are the VC's who love companies with no earnings going IPO and they cash in really good. 

For now our motto is: like the fish in the NEMO movie says -  

"Just keep buying, just keep buying" (like "just keep swimming..."). 

We closed CAT today. Our SNDK short worked well and we will close position today. We like ETSY here but want to wait for a week to buy. Still long BIDU & USO (doing very well). Our MO position is also doing good and as is TWTR.

Trucharts team

March 25, 2015

Is the Semiconductor stocks run over??


Stock Charts Free at Trucharts.com - Earnings, Real time Stock News and more:

Read this: Means semiconductor stock run is over. We were saying watch AAPL closely - the inclusion of AAPL in the DOW index is bad news - typically the this happens near the top for a stock. Just see MSFT and CSCO and then these crashed after being included in the DOW Index. We think so - just check the stocks we indicated that looked extended - AVGO, NXPI, SWKS.

http://blogs.barrons.com/asiastocks/2015/03/25/tsmc-the-writing-is-on-the-wall-sell-says-maybank/?mod=yahoobarrons&ru=yahoo


Take profits now.


Trucharts.com team

Markets falling falling - Market Update 3/25/2015

Markets falling falling - and Biotech crashing:

UPDATE: This link just added:

Free Charts for Stocks at Trucharts.com and more: 

Please read this excellent article on market valuation: 
http://www.marketwatch.com/story/stocks-are-overpriced-overleveraged-headed-for-trouble-2015-03-25?siteid=yhoof2&cb=logged0.5530515506397933

So the biotechs are coming down. TWTR was downgraded today - we had sold covered calls. In our weekend blog we talked about weakening technicals in spite of new highs and the extended stocks like AVGO,NXPI and SWKS - tech stocks look weak heading into earnings season - short MSFT.

Also check out BIDU (down today) - covered call written. Our call on shorting SCO looking good. TJX holding, LLY down but still a hold. Z (down) - hedged with covered call. USO up today.

Short APOL.

Chart here: www.trucharts.com/stockview.aspx?TICK=APOL 
(Stock is going to 0).

Shorting AMKR end of day:


March 16, 2015

Weekly Stock Blog 03/13/15 - Stocks to Watch and some good reads - Trucharts.com

Trucharts.com - Weekly Blog ending 03/13/15 - Good reads and Hot Stocks to watch

Sorry for the late posting - had some family obligations to tend to. 

What an amazing week in the markets - very volatile moves up and down - sounds like a roller coaster to me. We stated in our previous blog that the range would be between 2080 and 2050 for the SP500 and that is what we saw this past week. The markets rallied today and the resistance in the SP500 was expected to be 2080 and the DOW resistance around 18000 which is right at the 13d moving average. We will have to wait and see if the markets can break above this range now or will it consolidate or see a breakdown. 

With the BIGGEST news this week expected to be the Fed view on future interest rates - this is expected on Wednesday - economists are split evenly on what the Fed will do and we think that the Fed will stay put on rates till Fall or September knowing that the inflation pressures are muted due to the fall in oil prices. With the strong dollar and negative rates in the Eurozone, we do not see how the Fed will move to raise rates - the only concern on the Fed's mind will be asset bubbles in real estate and stocks. 

Here are some very good articles and reads for Fed interest rates:
Markets rallied today due to the USD pulling back from an extended move up - but we still like the USD - euro is headed lower and we think this may be a short term pullback into a bullish move in the USD. Again, we would expect to see a move after the Fed's comment on Wednesday on interest rates.

Let us take a look at some of the commodities - oil hit a new low today and is heading to our target price of $40 - the oil stocks bounced today - maybe a sign of some bottom in the oil sector - especially knowing that we are heading into the summer season. Keep an eye on the oil sector stocks.

We are long USO and short the calls against our position.

Gold is languishing here pending the Fed's view on rates and is still looking weak. Wait and watch.

We have been watching the Utilities sector stocks (XLU - ETF) as this sector has corrected over 20% due to the move up in yields and move down in bonds, and the move up in USD. We discussed this sector over the weekend in our meetup and pointed to stocks as (www.trucharts.com/stockview.aspx?TICK=SO), and (www.trucharts.com/stockview.aspx?TICK=PCG) - these moved up over 2% today. XLU is looking strong at the close of markets today.

We went long SO today and are long BIDU, USO, TWTR, BOX, Z, ANGI and LLY.  We are short UAL. Looking to go long AMGN.

The pharmaceutical sector - especially the BIOTECH sector took off again today - due to news from AMGN and Sanofi on the cholesterol drug findings - http://www.marketwatch.com/story/amgen-other-drug-company-shares-jump-on-cholesterol-drug-findings-2015-03-16?siteid=yhoof2. AMGN closed strong today and we like the stock. BMY broke out and LLY is also looking strong. Here are the charts:

AMGN stock chart
BMY Stock Chart

The tech sector looks interesting - we are very concerned after the INTC (www.trucharts.com/stockview.aspx?TICK=INTC) news of a lower revenue forecast. 

We expect that MSFT will also be impacted by this news as will the component suppliers to the the PC sector. There are some stocks that look very extended - NXPI, AVGO and SWKS.

Here are some other articles for reading:


Good luck trading.


Trucharts team


March 12, 2015

Markets Rallied Hard today and here are the reasons why


Free Stock Charts - Trucharts.com - Auto Buy/Sell Signal Strategies -


Markets rallied hard today - this was due to several factors:


1. VIX was up for the past few days

2. Dollar had rallied significantly in the past few weeks and was due for a pullback. 

3. Euro rallied from an oversold condition - but this move up will be short lived with the current negative interest rate environment in the Eurozone

4. Retail Sales were down and that inspired the bulls to think that the Fed would be refrained from raising rates in June

5. Health Stocks and utility stocks were looking oversold and therefore there was a good bounce - we expect a test of 2025 on the SP500 and we went long BIDU today with a covered call strategy - we discussed this strategy in our blog yesterday.
  • Check out our site for auto buy and sell signals for any stock, check out our real time news feature for before and after hours news and updates. We have technical mouseover charts for very quick technical analysis on our reports and earnings page.

Good Luck Trading.


Trucharts team 

March 8, 2015

Trucharts.com - Markets, Hot Stocks, Blog week ending 3/6/2015

Trucharts.com Blog week ending 3/06 and Hot Stocks to Watch Week of 3/9
What a jobs report - wow!! - even our numbers were not close enough to the actual numbers. Our estimate for March jobs report was around 230K on the high side and the number came in at 295K and unemployment rate dropped to a respectable 5.5%. We do not expect any slowdown heading into the summer season - the US dollar rallied and gold got crushed - we stated that gold was heading down in our previous posts - and here comes the probability that the Fed will be pushed to raise the Fed funds rate by June - we expect even that if they raise it by 0.25bp - would still be too low to affect the markets. There will likely be a short-term pullback - we indicated in our posts on fb and g+ that the markets looked extended and a pullback to 2050 should be expected. Also Mar 9th will be the 6 year anniversary of the bull market. The markets will be on the watch out for Fed statements going forward and the strength of the US dollar maybe hurting the export driven companies, but is a good sign for the US and the US economy. There should be some concern around job losses related to the oil industry - which we would expect to see happen within the next few months. We heard on the news of layoffs from HP and Ebay. But job hiring scene is still strong in many sectors. Majority of the job growth was in the in the service industry in the March jobs report. With the Fed still staying the course with ZIRP - we expect that the markets will consolidate here with some pullback heading into the Q2 earnings season. Support for the S&P is in the 2050 area.
Check out the videos and articles we posted on our G+ and FB pages.
Market Stats (from finance.yahoo.com) Friday close:
DOW JONES IND: 17856.78 - DOWN -278.94; S&P500: 2071.26 - DOWN -29.78; NASDAQ: 4927.37 - DOWN -55.44
ADVANCERS/DECLINERS: NYSE: 308/1574; (RATIO ~ 1:3) - NASDAQ: 858/1944 (RATIO ~ 1:2)
UP VOL/DOWN VOL (Millions): NYSE: 673/3177 (~1:5); NASDAQ: 541/1308 (~1:3)
We have been short AEMIBB (has been hurting but is a hedged position), Long ANGITWTR, Z, USO, DATA, LLY.
All of pur positions have calls or puts written against the position(s).
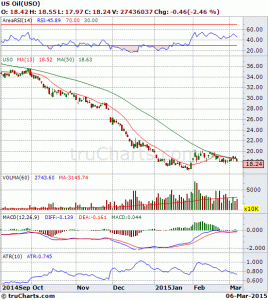
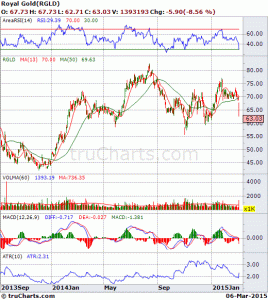
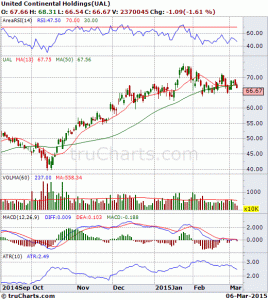
Here are stocks we are watching this week: Looking to short RGLD (or buy puts), Short UAL or buy puts and USO looks like it is pointing to lower oil prices - we have covered calls on USO. Here are the charts.
USO Stock ChartRGLD Stock ChartUAL Stock Chart


Check out the charts we posted in our blog last week.

Good luck trading - please check our page - Why Trucharts.com at: http://truchartscom.blogspot.com/p/why-is-trucharts.html.

Trucharts Team