
Trading/Investing Ideas/Market Commentary from TruCharts.com for stock traders/investors
Go Daddy Signup

Showing posts with label MACD. Show all posts
Showing posts with label MACD. Show all posts
July 25, 2020
June 27, 2020
Video update for Jun 27
March 16, 2020
Markets Panic amid the corona virus
Markets Panic amid the corona virus
Well, since our last post, markets have gone even further down and have pretty much wiped out the whole Trump elections gains in a matter of two weeks. We have been warning of bubbles and valuations being absolutely out of control and now reality is starting to come into focus. We suspect margin calls are also exacerbating the selling We were short and were long some puts and took on some longs today.. Two of our accounts was in an all cash position.
Still there is risk and we are waiting for some of our indicators to show when buying is safe. The bottom is not in yet and you may see some wild rallies - do not buy - but only use these to unload or do intraday trading - there is lot of money to be made here.. We will see a bottom and it will be very obvious once it arrives and the pent up demand will be huge... So be ready.
if you have not taken profits in stocks that are making money like AMZN, AAPL and MSFT along with FB, NFLX - we highly recommend taking profits.. These stocks have not reached a bottom yet even with the intermediate rallies.. Check out our tweets @trucharts and check out some of the charts we post during the week. We have been short AAPL, SHOP and ROKU.. We closed our ROKU position today..
Again - we recommend doing intraday trading and using options to collect and get good premiums. The bottom is not in yet as much as it may appear from the oversold conditions and the VIX.. We may see a short term rally here - but use these to sell..
Good luck trading..
Check out our site - for excellent real time charts, quotes and fundamental data along with our excellent screener..
B. Bhatia
Founder Trucharts.com
July 22, 2018
Our thoughts on the Tech Bubble and the everything bubble
The EVERYTHING Bubble:
It has been a long time since we published our last post. We have had a huge Trump rally since the election and the markets ramped in straight line. The FANG stocks have been the biggest contributors to the gain in the S&P along with the small cap indices hitting new highs.
Stocks like ALGN, NOW along with many others are trading at valuations that defy even the loftiest imaginations. ALGN is trading at a PS ratio of 18.8 (that is we are paying 18x times for every dollar in revenue - absolutely mind boggling numbers). In addition, there is no shortage of companies being funded by VCs at valuations that put the 2000 bubble to shame. Just recently DoorDash received a funding of 535M - that is over HALF A BILLION DOLLARS for a company that delivers food from restaurants.
Think about it - $535 M!! These mind boggling numbers are all a result of the non stop money printing from the Central Banks - the Fed, BOJ, ECB and the PBOC along with many other central banks. This is reminiscent of the 2000 bubble but above and beyond that. Real Estate is in another bubble - and everyone thinks that this will never stop or prices will never move lower. We all know that is not possible - there are limits to everything - simple motto - nothing goes up forever and nothing goes down forever.
Many of the DOW stocks are in downtrends - check stocks like CAT, DE - http://www.trucharts.com/stockcharts.aspx?tick=CAT
http://www.trucharts.com/stockcharts.aspx?tick=DE
The DOW is being held up by stocks like AAPL, UNH, BA and MSFT. Jeff Bezos has now become the richest person on earth - in a span of 2 years is net worth has moved over 100B - Bill Gates is not even close - think about it - one guy's net worth has crossed over 150B!!! Just in a span of less than 4 years. And yet the TV bobble heads are mesmerized by all of this - not a single talking head wants to say it is a bubble - SNB (Swiss National Bank - yes a bank) along with BOJ are buying stocks - when did banks start buying stocks - unheard of - yet folks it is happening.. Just take a look at some of the exponential charts we had exhibited in our last article and many of these stocks have been moving sideways but still at lofty levels. NVDA still trading at 13 times sales.. No revenue growth in many companies - yet the stocks keep trading at these lofty levels - that is called a BUBBLE.
We have central banks that are enamored by bubbles and bubble behavior - it is like being drunk and high - that feeling lasts only so long. Then we will get to the hangover. Stock buybacks are shrinking the pool of shares available and thereby help companies do financial engineering to goose up their EPS. But this is now a trading market and no longer a investing market - we strongly suggest keeping tight stops at the 100d SMA or 10% below the 50d SMA. Try to take some profits and have at least 30% in cash ready to invest. This has been a crazy market and it is now time to take some money off the table and wait for everything to unfold. We still like gold as a hedge - it has been moving in a tight range between 1200 and 1350 - we would nibble into gold and invest 15%-20% of investable assets.
SP500 has been moving sideways in a consolidation pattern and we have to wait and see what happens in terms of a breakout or breakdown. But is very tradeable - specially ETFs like SPY and SSO, along with the QQQ'. Rates will be going higher, so bonds should be moving down. Sell NFLX and look to short the semiconductors ETF SMH. The FANG stocks - are racing to the TRILLION dollar market cap - just think the FANG stocks are worth over $4.1T!!!
We will all be witnessing history here.. Keep your eyes and ears open.. but always learn when it is time to say - yes I have made a very good return and now it is time to take it to the bank..
Check out our site - our screener is excellent and also do subscribe - checkout our pages - we offer features above and beyond other sites:
http://www.trucharts.com/stockcharts.aspx
Subscribe
Dynamic Screener
Good luck trading..
Founder/CEO (trucharts.com) - Co-Founder (Jetstox.com)
November 12, 2017
Kink in the market's armor - Is the pullback coming from these lofty levels??
Kink in the market's armor - Is the pullback coming from these lofty levels??
Are we starting to see a kink the market's armor. Was the 1 year anniversary of the election a mark of a short term or a long term top? What should we expect going into the end of the year and heading into 2018?
Exponential moves in many stocks as been very characteristic of this move in the markets. There has been narrow leadership and everyone, just like in the year 1999-2000, has been loading up in tech stocks and tech stock funds. It seems like we never learn from previous bubble manias and even though we are truly in a bubble with stocks trading at valuations not seen since 2000 and even the market multiples for many metrics above and beyond 1929, 2000 and 2007, none of the analysts (who by the way are in no way responsible for their recommendations) are NOT telling their clients to take profits and wait for better prices. Short covering has also extended many of the popular stocks and obviously the FAANG stocks along with some others in the market - keep flying high. Financial engineering, stock buybacks and earnings manipulations have become a way of keeping prices elevated. The level of complacency is unbelievably striking - there is no respect for risk.
Every person you speak to thinks that there will never be a financial crisis or a major pullback in the markets. Personally, I believe in simple math and that there is always a reversion to the mean and trust me the mean is way below where the markets are. Typically 50d, 100d and 200d SMA are very critical in determining where the markets should find as support levels. Bubbles in real estate (many house flipping shows on TV - similar to 2007), bond bubble (scares the shit out of me) and along with the stock bubble is mind numbing. The funding of startups day in, day out, is also a stark reminder of the days of 1999-2000. Startups that will vaporize and end in total losses will be the norm soon.
Everyone thinks they are an investing genius and there is no way they will lose - that is when you have to take a contrarian view of the markets. Folks willing to fund companies like SLACK (nothing unique), WeWork, and many others at valuations that make your head spin has become norm and every next investor is trying to better up the next one by showing who is boss. This is NOT normal.
The Fed and central banks around the world will be responsible for the next pullback and it will not be pretty. Market capitalizations of many companies are at mind boggling levels and unheard of. Some market capitalizations dwarf GDPs of certain countries and yet everyone thinks we are going higher. We think it is a serious time to start looking into taking profits and buying some protection in certain high flying stocks and sectors (semiconductor being at the top of the list).
We suggest looking at puts for Jan 2019 for stocks like ALGN, ISRG and some other high flying stocks like RACE, NVDA and many others. Keep an eye on HYG and JNK - these are he ETFs related to the high yielding and junk bonds - these are pulling back and have a very good correlation coefficient to the market indices.
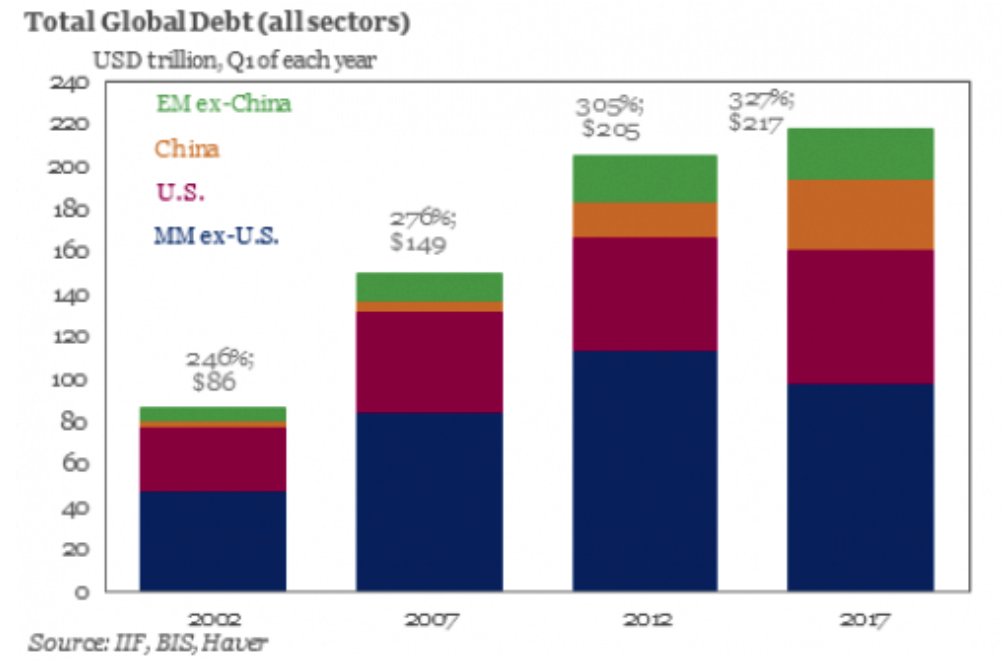
Consumer debt is at all time highs - credit card debt is now at over $1T - yes that is a T.... Car loans, housing debt and HELOCS, student loans are at all time highs. We are a world in debt and it is all going to end badly.
Debt/GDP ratios for China is at a staggering 280% and going higher - and other nations debt/gdp ratios are also at staggering highs - all this debt has been created in one decade. The central banks have managed to print so much money that it dwarfs everything we have printed in over 100 years - they have managed to do it in 10 years - that tells you why we are in a bubble. Japan markets are being driven higher because the government is buying stocks - can you believe that - government buying stocks!!! it is the quintessential final nail in the coffin or basically giving up on the basic equations of economics - normal market cycles and following simple rules of the law of numbers and laws of supply/demand and demographics.
Charts for: DIA, LRCX, ALGN and NVDA below: EXPONENTIAL MOVES NEVER END NICELY. We recommend taking profits aggressively.


Here some article links for your reading:
Yearly subscription is only $180 and you can also get access to our automated trading algorithms and if you enter your portfolio - you will get portfolio emails at end of day indicating the technical picture of your stocks and whether these are buy, hold or sell. Only for paying subscribers.
Good luck trading.
CEO/Founder - Trucharts.com
November 1, 2015
Best October Market Rally, Do you Buy, Sell or Hold?
Best October Market Rally, Do you Buy, Sell or Hold?
Trucharts.com Blog update week of 10/26/2015
Well again due to some business commitments we were unable to update our weekly blog for over two weeks now. We are finally back and updating our readers on what has transpired and with all the financial media going nuts over the best October rally, we have to sit back and see what to do next and plan for Q4. Check out our site for the best buy/sell signals for stocks and just apply it on BABA stock and you will see why we went long at 62.. Go tot the stock charts page and click on the Trucharts Trading Strategies bar - seen in red below and you will get the different trading strategy options to apply to the chart - (please read our disclaimers - please do your due diligence and consult with your financial adviser before making investment decisions) - this is for information purposes only. We offer this to our paying and free subscribed users only. You can try this on VRX and you will see it generated a SELL signal around 220.

There is no doubt that the rally was expected. We had discussed this in our last blog and our updates via twitter (twitter handle: @trucharts) and on facebook at (https://www.facebook.com/truchartscom-273554162830234/) - we expected S&P to reach around 2100, DJIA to reach around 17800 to 18000 and that is exactly what the indices did during the October rally and with earnings season in full force - markets responded to stocks with good earnings. We believe that this is a short lived rally and even if we hit new highs, we would sell into the rallies. Markets are not significantly overbought yet so we expect some sideways movements in the indices. The Fed spoke (amazing) and now that they realize they are well behind the curve in raising rates, the again tried to spook the markets by indicating a possible rate hike for December. Markets are in bubble mode - real estate along with it and it is not just here but all around the world. We have bubble blowers and Central banks printing money while earnings from companies are drying up and not even meeting lower estimates. The Wall Street gang plays this game beautifully, lower the estimates and when the companies report slightly better results, the street starts their cheering. One has to look through the numbers - but from a technical trading point of view you just have to be ready to trade based on the earnings announcements. Here are some charts for the S&P , DJIA and a chart we pulled from a very interesting article on M&A activity which typically tends to peak around market tops.
ADDED: Another good read:
http://www.zerohedge.com/news/2015-10-31/quick-bull-vs-bear-case-8-charts
Link to article: http://finance.yahoo.com/news/ubs-beginning-end-bull-market-131106708.html
Source Bloomberg/UBS:


From the charts below for SP500 and DJIA we expect sideways movement and possible new highs into Q4 due to a typically strong Q4 season for the markets and we would lighten up into this sideways and possible upward movement. We would not hesistate to write covered calls on long positions. We have done that already for many of our accounts. Many tobacco stocks appear overbought, so we would either sell these or hedge with puts or reduce cost basis via covered call strategy. We are long PM and LLY. Our MRK position got called away.
As you can see the MACD is getting extended as is the RSI reaching overbought conditions. But we expect this to last for sometime with minor pullbacks and sideways movements.


We would lighten up on biotech stocks and health insurance companies. We believe that Obamacare is a total disaster and will very likely get repealed if the GOP takes the White house. The premiums are unaffordable and we are seeing several co-ops going out of business due to high costs and then the insured are being put into a situation with no coverage and high costs. We believe this will not end well and there will be a new wave or change in the healthcare system in this nation. The current scenario is not sustainable and is designed heavily in the favor of insurance companies and drug companies. We also think these insurance companies may have reached a peak in their earnings cycle. Our net portfolio is short tech stocks. AAPL seems to have peaked and we do not expect any major move in AAPL - we still like NFLX - as Q4 is a strong season for them.
Good luck trading.
Trucharts team
September 6, 2015
Markets - Up and Down - What to do now - BUY or SELL?
Markets - Up and Down - What to do now - BUY or SELL?
Happy Labor day to all.
Well what do we think of the markets here and the direction. We stated in several blogs that markets were exhibiting topping action and we told our readers to take profits, sell rallies and reduce exposure or go short the semiconductor and biotech sector. We have been following this advice in our own portfolio. We have been net short since late June.
Markets have been bouncing from the recent crash and everyone was getting excited. This tells us that the people are still not scared enough and the folks on CNBS (got this of the web and I love it) are still very bullish in light of the market action. The VIX is still elevated and the ISEE call put ratio is still biased towards more put buying - we have not seen such a long string of the ISEE C/P ratio trend towards put buying. Markets dropped on Friday heading into the Labor day weekend.
Major ETFs reflecting the DOW (ETF: DIA) and others have closed below their respective 100 week SMA. This is definitely not a good sign. We think the markets are headed lower to the 200d weekly SMA and maybe to the next support of 15000 for the DOW. We still recommend lightning up on your positions and take profits in any rally. Companies earnings forecasts are not strong and many are even lower than consensus forecasts. Just take a look at DE. JOY and the semi companies. Stocks are driven by earnings and stocks with their downward movements are indicating lower earnings coming in the future. Corporate buybacks and earnings number rigging along with Fed liquidity was what was driving the markets. You can expect short term rallies due to oversold conditions - but the trend is still down and we would wait before going net long. Insiders have been selling stocks at a rapid pace and they were doing so when the markets were topping - Major insiders in the biotech sector and semi sector dumped a lot of stock at the peak - this tells us that they got extremely rich and do not anticipate any higher prices - the markets were priced to perfection and the markets had gone up without even a 10% correction for over 3 years. We have shown some of charts below.
This past weekend the finance minister for China said that the China stock bubble had burst and this tells us that the Chinese government reactions and intervention in their stock markets is not working - and guess what happens - the Chinese citizens promptly move their money into real estate - the cycle never ends. We will have to wait and see how all the events play out in China.
China is definitely slowing down and this is the world's second largest economy. They are mired in over capacity and nit driven by internal consumption. We think this is impacting the world economy and the commodity complex as China is the biggest consumer of the commodities.
Housing prices are again up in the US and heading into another bubble and we think this is definitely in the back of the Fed's thought process and with unemployment hitting the 5.1% well within the target range of full employment for the Fed - we think there is going to be pressure on the Fed to raise the Fed Funds rate. We have now the highest rate of employment participation (that means majority of the employable folks have stopped looking for a job).
From a stock perspective - we would not go long any of the semi stocks - we like SLAB possibly - but be mindful - you can take a position if you do not mind averaging down. We would hedge all our positions by selling covered calls and or you can sell puts if you want to own a stock. Now for shorts (be mindful we do not recommend shorting for amateurs - this is for experienced folks) - we still think IBB offers the best shorting opportunity here along with AMBA stock. We are short IBB and AMBA (since 115). Even though some of the indicators are oversold on a daily basis, the weekly indicators are not oversold yet.
We recommend watching this documentary (on youtube) on how OIL controls the world and how the "SEVEN SISTERS" control the world's oil: https://www.youtube.com/watch?v=XtYOjMmEMeg - it is called the 'Secret of SEVEN SISTERS' - unbelievable.
Check out our buy/sell strategies automated on your portfolio to see if your stock is still a buy or sell signal - try this on weekly and daily chart. Use the Stock charts page to check this.
As we said last week - we are self funded and would like to get more subscribers so we can look for an investor to help us take the site to the next level - we would like to ask our readers and users to subscribe - it is a measly $9 or $15 per month to get the best feature set on the web and we know this since our returning user base is engaged on our site for more than 12 minutes a session. We use very minimal budget for marketing - we use our funds primarily for development, paying salaries to our developers, and servers, news/data feeds.
Here is the link to the subscription service page: http://www.trucharts.com/truCharts_Services.aspx
Here are the weekly charts along with our trendlines drawn:


Good luck trading.
Trucharts team/Founder/CEO
August 30, 2015
Fed Speak - What to do with your portfolio this week and market direction - UP or DOWN!
Fed Speak - What to do with your portfolio this week and market direction - UP or DOWN!
We just went through one of the most volatile weeks in the markets since the dog days of 2008-2009 financial crisis. Is China slowing, what is the Fed going to do and is the world headed into a recession? So many questions and the answers are not very clear. From a volatility perspective, the VIX hit the highest levels on Monday last week when the DOW traversed over 4500 points - this has never happened before - there were huge opportunities to buy at the lows that day and make a huge profit - volatility is truly a trader's gift and an easy way to generate some very quick profits - if you are a technical trader it becomes even easier. You have to make your preferred stock list and watch those only else you will not be able to choose during big market moves, like the one we had last Monday 8/24. We did make money as we were net short into the market and would have really preferred to get into some stocks that tanked at the open - we knew that the markets would bounce - since it was an oversold condition and markets did rebound into the end of the week - just go check some of the low prices for some of the top stocks on 8/24. Several stocks opened down over 20% and then recovered very nicely. That is why you have to have cash set aside for trading on volatile days - because the returns can be magnificent.
Markets rebounded over 1000 points on the DOW late into the week and many stocks bounced off the lows - there was short covering and some buying buy the big funds since they saw this as a huge buying opportunity - we saw the fund managers discussing this on TV. Volatility numbers are still high and we would expect volatility this week also. Major trend-lines have been broken and we have to test the trend-lines and the previous support levels (which are now resistance levels) for all the indices.
Fundamentally we do not think the economy or the tech stocks have bottomed - China slowdown and the issues/headwinds they are facing from their bad loans, high debts, exports slowing, over capacity are going to have repercussions around the world. US economy is still strong with the jobs numbers still ahead of the 200K/month magic mark and we think the Fed sees this and is ready to pull the trigger in September. We still suspect whether the Fed will actually raise the Fed Funds rate in Sept. We wil have to wait and see - from our perspective we do not think they have the 'guts' to do it.
China intervention into their stock markets was one of the worst ideas and then they have been so reactive to every little piece of economic news, that they are acting like a 2 year old's in a candy shop. Lowering RR ratios, cutting interest rates, injecting cash, and so many others drastic measures, it makes one wonder what really is going on in China.
Is it really that bad!!
There was The Jackson Hole meeting this weekend and the Fischer indicated that the Fed would move towards hiking rates. They know there is a bubble and they are trying to defuse it before it becomes bigger and then they are left with no tools to fight it. We will just have to wait and see with the numerous number of crazy commentary on CNBC and Bloomberg non stop about the Fed's plans. It is getting really ridiculous!!
As we write this futures are down - we expected that heading into Mondays' - typically weak in recent weeks.
Anyway, we expect the markets to consolidate here within a 500 point range - with a topside target of 17000 and low of around 16000. S$P500 to be range bound between 1920 and 2040 range. NASDAQ which was primarily up because of biotech stocks should start seeing some pullback.
Use this opportunity to lighten up on tech stocks - fundamentally there has been no change in their outlook and forecasts - the trend is down and we expect it to stay that way. With Apple's event coming Sept 9th, we expect that the tech stocks may stay range bound here. We like SLAB for short term trade. We are short AMBA (earnings on Sept 1),SWKS,INTC,PYPL and MU. Our shorts did well for us during this downdraft. We were discussing topping action in the markets and we were ready for it. Long NFLX. We use options to hedge all our positions.
Commodities - oil bounced - expect that to be short lived - we are heading into the slowest season for oil - post summer time. Still some money to be made from short term trading here - check out chart for USO and OIL. Possibly very oversold - should go up for short term. Gold Bounced - we are keeping a close eye on this - as it is tied to the dollar - but with the weaker currencies abroad, we think gold can shine - wait and see.
Here are the charts for DIA daily and weekly - Daily chart shows an oversold condition and weekly is not oversold yet. Watch these carefully along with the VIX. We always trade stocks which have underlying options and are very liquid. We like DIS for short term - looks oversold. Do not like biotech - short IBB.


Please check out our site and provide us your feedback and do check our lowest subscription rate in the industry for all the features we offer. Here are some links and thanks for reading and visiting/supporting our site - we are entirely self funded and still losing money but trying our best to provide our users a good experience to make sound and good investment decisions - we offer the automated buy/sell signal strategies for users to see if the stocks in their portfolio is a buy or a sell. Trust me it has saved me a lot of grief in stocks like RIG.SDRL,USO and many more. I am so glad we have that feature.
We would love to get subscribers so we can keep the site going and it is the price of 2 lattes at Starbucks per month.
For subscription visit: http://www.trucharts.com/truCharts_Services.aspx
For features we offer visit: http://truchartscom.blogspot.com/p/why-is-trucharts.html
Good luck trading. Stay nimble.
Trucharts Team/Founder/CEO
August 23, 2015
Markets - What to do now? BUY,SELL,IGNORE,HOPE & PRAY
Markets - What to do now? BUY,SELL,IGNORE,HOPE & PRAY - Trucharts.com Weekly Blog Update - week ending 8/21/2015
Well we finally are getting some excitement in the markets.. Before we get into the gist of our discussion today after the amazing week we had - where the DOW plunged over 1000 points and VIX (volatility index) moved up finally, we would like to list the key viewpoints we have been discussing in our past blogs regarding the market action:
- There has been sideways movements with triple digit moves every week (9-12 weeks)
- Markets have been exhibiting very clear topping action
- Narrow Breadth, narrow leadership, New Highs and New Lows ratio skewed to the downside
- Oil and commodity complex crashing (we said oil dropping was a big deal)
- China - China - China - over mired in debt and capacity in all sectors
- WE HAD STATED THAT CHINA WILL HAVE NO CHOICE BUT TO DEVALUE AND THAT IS EXACTLY WHAT THEY DID - IT WAS THEIR DEFACTO STIMULUS AND WE EXPECT FURTHER DEVALUATION OF THE YUAN - headed to 6.7-6.8 to USD range
- Transports sector down
- We have been saying sell into any rallies, take profits and hedge your positions
- DO NOT listen to the talking heads on TV - it is all BS
- NASDAQ was being buoyed by the biotech stocks and these were going to breakdown and were the new darlings of Wall Street along with the big internet names
- Earnings and Revenue forecasts were lower for the next qtr from many sectors -specially the tech sector
- Valuations in many internet stocks like FB,PYPL,etc were at ridiculous and lofty levels along with the valuations being given to companies like UBER etc in the private placement
- INTC and MU earnings were key and we had stated that the semi-sector was headed for a major slowdown. We said short INTC,AMBA,SWKS,HAL and MU
- We had hedged our longs with covered calls to reduce cost basis
- IBB ETF closed below 13 week SMA the week ending 8/14 for the first time in over 15 months
Well now everyone is wondering what next - what are you going to do with your portfolio - Well guess what - we are staying on the same viewpoint and thesis - Sell into rallies, take profits and short IBB (could be the best short). Markets will bounce - but these will be short lived - you can expect more volatility in the next few weeks. You will see clearly below in the charts below that major trendlines have been broken for all indices and the close below major moving averages is a big concern to us. We still like the INTC,MU,AMBA short and are shorting IBB/GILD. We were long NFLX - but with a covered call strategy. We will close half our position and wait for a better entry point. We will look to buy some index ETF on any bounce - target range for DOW is first support 16000 and then around 15000. We think PYPL could be another great short - we are short PYPL.
You can also use our BUY/SELL automated trading strategies on the stockview page to see where sell signals were generated and try to see which stocks in your portfolio are on a SELL signal - do this on weekly and daily charts for your stocks.
Here is the page: www.trucharts.com/StockView.aspx
Here is the image of trading strategy box on the page above: You have to click to expand the box:

Here are some charts we would like to show this week - look at the trendline and averages - these are weekly charts - please look at RSI and MACD - these are headed down:


We love documentaries and our recommendation for this week is an amazing documentary on smart meters and why you should not allow these in your neighborhood - we live a world of tyranny and corporate corruption and power: You can see this one on AMAZON or YOUTUBE.
March 22, 2015
Where are the markets headed this week and hot stocks to watch - Trucharts.com Blog
Trucharts.com Blog week ending 3/20/2015
Where are the markets headed this coming week and what are the hot stocks to watch this week.
The Fed spoke and the markets rocketed higher last week and gold moved higher and stocks responded positively to the Fed comments - bonds moved higher and yields dropped, the dollar was crushed for a short time and then bounced back. We still like the US dollar and we expect the Euro to head lower. The Fed is cornered and scared to do anything to upset the markets - and they are into playing 'WORD' games - patient and impatient etc. It is truly absurd how the markets are so hung up on words from the Fed. The markets were driven down heading into the Fed meeting and then the VIX got crushed and all the market indices rocketed higher right after the Fed meeting. Basically the Fed said they will not raise rates in June - something that was not surprising to us - we do not expect the Fed to raise rates at all this year even though there is lot of jawboning going on by the Fed and it's governors.
The DOW JONES INDUSTRIALS climbed above the 18K number - NASDAQ buoyed by the flaming biotech stocks and semiconductor stocks breached the 5000 mark and has everyone now waiting and talking about breaking the 2000 high - which we expect is coming to get all the news talking heads excited and bubbling with joy.
Biotech stocks the darlings of Wall Street are having price movements like the internet stocks of 2000 - we do not know when or how this is going to end - companies are buying other smaller rivals or companies with potential blockbuster drugs - and this can last as long as we are in this Fed driven rally and a zero interest rate environment - which says keep taking risks until We (the FED) says time out.
Technically speaking even though the RSI and MACD are exhibiting lower highs with this move up - the patterns seems to indicate higher highs. The NASDAQ is technically broken out to a new high. There maybe some pullbacks (consolidation) - but the trend is for higher highs. We are heading into earnings reporting season and need to be on guard for any potential earnings warnings - please keep these in mind prior to taking any big positions or longer term bullish positions.
AAPL was integrated into the DOW Industrials this week and is a Dow component now. We would be watchful of AAPL here. SBUX announced a stock split this week and SWKS, NXPI and AVGO hit brand new all time highs. Check out our reports page at www.trucharts.com/marketreports.aspx for stock lists with technical breakouts etc.
The biotech sector is on fire and we were wrong on our call in this sector but still believe that this sector is definitely overextended - but right now the sector is still in the hands of the bulls - just check stocks like www.trucharts.com/stockview.asp?TICK=REGN - please check the stock from period 2000 to now and you will see what we mean by exponential moves.
Stocks we picked last week - LLY and SO, PCG did well during this week and LLY was up over $6 from our pick price.
Stocks we like this week - TWTR, MYL and TEVA - we will be watching these closely and be looking to go long TWTR. Here are the weekly charts (TEVA is breaking out):


Good luck trading.
Trucharts.com team and Founder
Subscribe to:
Posts (Atom)