Go Daddy Signup

Showing posts with label Tech bubble. Show all posts

March 16, 2020

Markets Panic amid the corona virus

Markets Panic amid the corona virus


Well, since our last post, markets have gone even further down and have pretty much wiped out the whole Trump elections gains in a matter of two weeks.  We have been warning of bubbles and valuations being absolutely out of control and now reality is starting to come into focus. We suspect margin calls are also exacerbating the selling  We were short and were long some puts and took on some longs today.. Two of our accounts was in an all cash position. 

Still there is risk and we are waiting for some of our indicators to show when buying is safe. The bottom is not in yet and you may see some wild rallies - do not buy - but only use these to unload or do intraday trading - there is lot of money to be made here.. We will see a bottom and it will be very obvious once it arrives and the pent up demand will be huge... So be ready.

if you have not taken profits in stocks that are making money like AMZN, AAPL and MSFT along with FB, NFLX - we highly recommend taking profits.. These stocks have not reached a bottom yet even with the intermediate rallies.. Check out our tweets @trucharts and check out some of the charts we post during the week. We have been short AAPL, SHOP and ROKU.. We closed our ROKU position today.. 

Again - we recommend doing intraday trading and using options to collect and get good premiums. The bottom is not in yet as much as it may appear from the oversold conditions and the VIX.. We may see a short term rally here - but use these to sell.. 

Good luck trading..

Check out our site - for excellent real time charts, quotes and fundamental data along with our excellent screener..

B. Bhatia
Founder Trucharts.com

July 22, 2018

Our thoughts on the Tech Bubble and the everything bubble

The EVERYTHING Bubble:

It has been a long time since we published our last post. We have had a huge Trump rally since the election and the markets ramped in straight line. The FANG stocks have been the biggest contributors to the gain in the S&P along with the small cap indices hitting new highs.

Stocks like ALGN, NOW along with many others are trading at valuations that defy even the loftiest imaginations. ALGN is trading at a PS ratio of 18.8 (that is we are paying 18x times for every dollar in revenue - absolutely mind boggling numbers).  In addition, there is no shortage of companies being funded by VCs at valuations that put the 2000 bubble to shame. Just recently DoorDash received a funding of 535M - that is over HALF A BILLION DOLLARS for a company that delivers food from restaurants.

Think about it - $535 M!! These mind boggling numbers are all a result of the non stop money printing from the Central Banks - the Fed, BOJ, ECB and the PBOC along with many other central banks. This is reminiscent of the 2000 bubble but above and beyond that. Real Estate is in another bubble - and everyone thinks that this will never stop or prices will never move lower. We all know that is not possible - there are limits to everything - simple motto - nothing goes up forever and nothing goes down forever.

Many of the DOW stocks are in downtrends - check stocks like CAT, DE - http://www.trucharts.com/stockcharts.aspx?tick=CAT
http://www.trucharts.com/stockcharts.aspx?tick=DE

The DOW is being held up by stocks like AAPL, UNH, BA and MSFT. Jeff Bezos has now become the richest person on earth - in a span of 2 years is net worth has moved over 100B - Bill Gates is not even close - think about it - one guy's net worth has crossed over 150B!!! Just in a span of less than 4 years. And yet the TV bobble heads are mesmerized by all of this - not a single talking head wants to say it is a bubble - SNB (Swiss National Bank - yes a bank) along with BOJ are buying stocks - when did banks start buying stocks - unheard of - yet folks it is happening.. Just take a look at some of the exponential charts we had exhibited in our last article and many of these stocks have been moving sideways but still at lofty levels. NVDA still trading at 13 times sales.. No revenue growth in many companies - yet the stocks keep trading at these lofty levels - that is called a BUBBLE.

We have central banks that are enamored by bubbles and bubble behavior - it is like being drunk and high - that feeling lasts only so long. Then we will get to the hangover. Stock buybacks are shrinking the pool of shares available and thereby help companies do financial engineering to goose up their EPS. But this is now a trading market and no longer a investing market - we strongly suggest keeping tight stops at the 100d SMA or 10% below the 50d SMA. Try to take some profits and have at least 30% in cash ready to invest. This has been a crazy market and it is now time to take some money off the table and wait for everything to unfold. We still like gold as a hedge - it has been moving in a tight range between 1200 and 1350 - we would nibble into gold and invest 15%-20% of investable assets.

SP500 has been moving sideways in a consolidation pattern and we have to wait and see what happens in terms of a breakout or breakdown. But is very tradeable - specially ETFs like SPY and SSO, along with the QQQ'. Rates will be going higher, so bonds should be moving down. Sell NFLX and look to short the semiconductors ETF SMH. The FANG stocks - are racing to the TRILLION dollar market cap - just think the FANG stocks are worth over $4.1T!!!

We will all be witnessing history here.. Keep your eyes and ears open.. but always learn when it is time to say - yes I have made a very good return and now it is time to take it to the bank..

Check out our site - our screener is excellent and also do subscribe - checkout our pages - we offer features above and beyond other sites:
http://www.trucharts.com/stockcharts.aspx
Subscribe
Dynamic Screener

Good luck trading..

Founder/CEO (trucharts.com) - Co-Founder (Jetstox.com)

November 12, 2017

Kink in the market's armor - Is the pullback coming from these lofty levels??


Kink in the market's armor - Is the pullback coming from these lofty levels??


Are we starting to see a kink the market's armor. Was the 1 year anniversary of the election a mark of a short term or a long term top? What should we expect going into the end of the year and heading into 2018?

Exponential moves in many stocks as been very characteristic of this move in the markets. There has been narrow leadership and everyone, just like in the year 1999-2000, has been loading up in tech stocks and tech stock funds. It seems like we never learn from previous bubble manias and even though we are truly in a bubble with stocks trading at valuations not seen since 2000 and even the market multiples for many metrics above and beyond 1929, 2000 and 2007, none of the analysts (who by the way are in no way responsible for their recommendations) are NOT telling their clients to take profits and wait for better prices. Short covering has also extended many of the popular stocks and obviously the FAANG stocks along with some others in the market - keep flying high. Financial engineering, stock buybacks and earnings manipulations have become a way of keeping prices elevated. The level of complacency is unbelievably striking - there is no respect for risk. 

Every person you speak to thinks that there will never be a financial crisis or a major pullback in the markets. Personally, I believe in simple math and that there is always a reversion to the mean and trust me the mean is way below where the markets are. Typically 50d, 100d and 200d SMA are very critical in determining where the markets should find as support levels. Bubbles in real estate (many house flipping shows on TV - similar to 2007),  bond bubble (scares the shit out of me) and along with the stock bubble is mind numbing. The funding of startups day in, day out, is also a stark reminder of the days of 1999-2000. Startups that will vaporize and end in total losses will be the norm soon. 

Everyone thinks they are an investing genius and there is no way they will lose - that is when you have to take a contrarian view of the markets. Folks willing to fund companies like SLACK (nothing unique), WeWork, and many others at valuations that make your head spin has become norm and every next investor is trying to better up the next one by showing who is boss. This is NOT normal. 

The Fed and central banks around the world will be responsible for the next pullback and it will not be pretty. Market capitalizations of many companies are at mind boggling levels and unheard of. Some market capitalizations dwarf GDPs of certain countries and yet everyone thinks we are going higher. We think it is a serious time to start looking into taking profits and buying some protection in certain high flying stocks and sectors (semiconductor being at the top of the list).  

We suggest looking at puts for Jan 2019 for stocks like ALGN, ISRG and some other high flying stocks like RACE, NVDA and many others. Keep an eye on HYG and JNK - these are he ETFs related to the high yielding and junk bonds - these are pulling back and have a very good correlation coefficient to the market indices. 

Consumer debt is at all time highs - credit card debt is now at over $1T - yes that is a T.... Car loans, housing debt and HELOCS, student loans are at all time highs. We are a world in debt and it is all going to end badly.

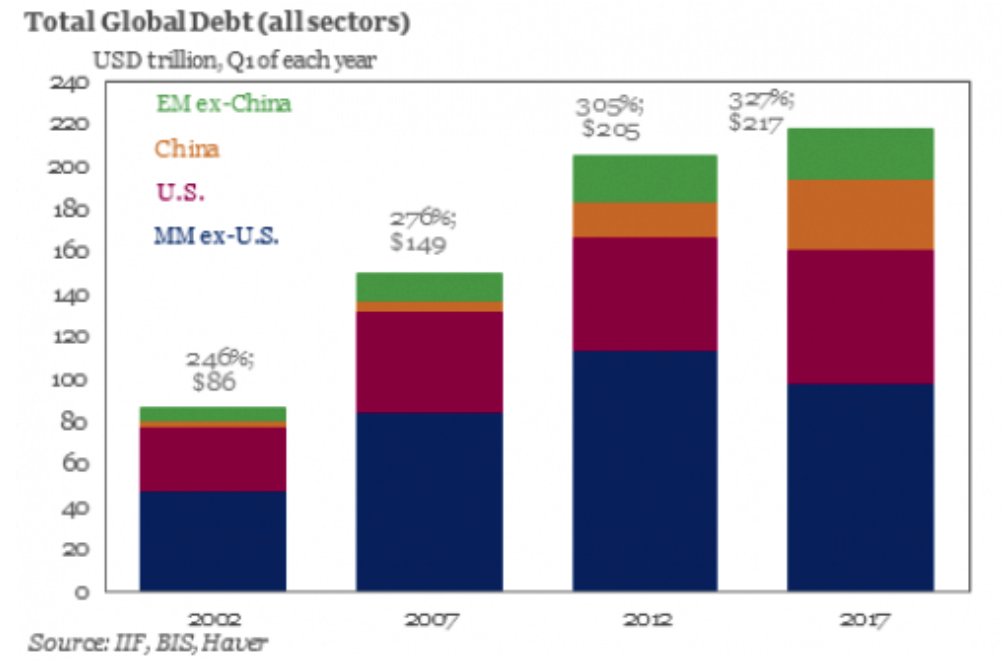
Debt/GDP ratios for China is at a staggering 280% and going higher - and other nations debt/gdp ratios are also at staggering highs - all this debt has been created in one decade. The central banks have managed to print so much money that it dwarfs everything we have printed in over  100 years - they have managed to do it in 10 years - that tells you why we are in a bubble. Japan markets are being driven higher because the government is buying stocks - can you believe that - government buying stocks!!! it is the quintessential final nail in the coffin or basically giving up on the basic equations of economics - normal market cycles and following simple rules of the law of numbers and laws of supply/demand and demographics.


Charts for: DIA, LRCX, ALGN and NVDA below: EXPONENTIAL MOVES NEVER END NICELY. We recommend taking profits aggressively.
DIA LRCX chart


Here some article links for your reading:


Yearly subscription is only $180 and you can also get access to our automated trading algorithms and if you enter your portfolio - you will get portfolio emails at end of day indicating the technical picture of your stocks and whether these are buy, hold or sell. Only for paying subscribers.


Good luck trading.

CEO/Founder - Trucharts.com


July 13, 2017

Fed testimony, Markets, Tech Stocks and Backtest feature on our site


Fed testimony, Markets, Tech Stocks and Backtest feature on our site


LATEST UPDATE: Yellen dovishness sparked huge market move and tech stocks came off oversold conditions. Revenue growth is not there - but we are in bubble mode. We like the following pair trade - Long NFLX calls, Short NVDA. VIX is at all time low and volume in markets is also low - therefore the grind higher. Keep tight trailing stops. SP500 is going to 2500 and DOW to 22000. No stopping this bubble - we like also KLAC and AMAT. BA was our top pick and we still like it.

Brief update on the markets and Yellen testimony. 

Well looks like the squirrel went back into its hole - Yellen and the central bankers are now clueless as to what to do - one moment they are hawkish and then the next two weeks they become dovish. They are so scared now to raise rates, that they have just completely given up. They talked about reigning in the monetary stimulus via draining liquidity from the system by selling their assets on their huge balance sheet of over $4T - loaded with mortgage backed securities. They want to start this in September and increase that as they go along. In addition, Grandma Yellen also indicated that she may not be raising rates (of course that would increase our debt burden) T aggressively - the markets rocked up in a straight line, dollar crashed but gold was up slightly. Basically the Fed is saying we do not care about the bubbles, asset valuations and whatever else the loose monetary policy has unleashed in asset bubbles around the world. Case in example - do you know that the Indian stock market is up over 1000% - yes 1000% - in 14 years - no one is mentioning that the Indian banks are drowning in NPLs - but yet the market is up over 1000%. PEs and company valuations in the US are at levels not seen since the 2000 and 2007 heights and moving higher. But the central banks do not care as this is making the rich richer and the goal is to make the average guy feel richer. Nasdaq is out performing and we are heading into earnings season for Q2 - we will have to wait and see how the companies manipulate their results using financial engineering and stock buybacks etc. Oil has been crashing - we had predicted that and we will have to wait and see how that plays out. Tech stocks are rocking and rolling like there is no bound to valuations and PEs - sounds like the 1999-2000 bubble times (i remember those days very distinctly). FAANG stocks are rocking and we like NFLX and AMZN. FB is breaking out and we need to watch carefully where it goes. We like BABA, QCOM, BA, CAT, LLY, AAPL and are short NVDA. Airline stocks like UAL are about to breakout and rail stocks along with defense stocks look good. Even though there may be issues with the valuations etc., these do not matter as we are in full bubble mode - in Bay area people are over bidding on houses by over 350K with multiple offers - exactly like 1999. We expect this to continue. In addition, we are not seeing any real technical weakness in the markets other retail and oil stocks. We also like EEM as merging markets are doing well.

Always put a stop limit loss of 5% to 10% below 50d SMA to limit your loss or gains in case there is a crash. Check these values on weekly charts also - like 13 week and 20 week SMA.

Also spend your time to learn how to trade options - it helps to reduce and improve your portfolio risk and return.


There is a very unique feature on our site - call backtest and we use it for checking certain technical analysis parameters for many stocks to see which yield the best winning results. Here is an example for stock Facebook or FB and you can see one of our trading strategies generated a buy signal on 7/7 and the results showed that this was a very strong signal for FB and it yielded 7 winners and 1 losing trade. So there was a very high probability that the signal would yield to higher prices and sure enough the stock moved over $8 in 3 days to 159. See the snippet of the testing below:

It is tested over 600 trading bars and the results are amazing. We will be restricting use of this to paid subscribers only very soon and you have a chance to test it out. You can also check out our videos on youtube - links are on our site - www.trucharts.com.

Good luck trading.

July 3, 2017

Is Tech Party over Fed and Grandma Yellen, ECB and Grandpa Draghi..

Is the Tech Stock party over??


So did the Fed crash the tech party and the bubble it created - what will it do to other asset bubbles. What will happen in the future with all the debt built up into the system and why have the billionaires become even richer in this cycle. The answer is Greed!! The Fed, ECB and central banks know that there is no way out of this debt cycle and bubble they have created and are responsible for. In the name of trying to save doomed and heavily taxed economies of the world and then making promises they cannot keep, the central banks are in a big bind - keep printing money and grow the debt or try to drain the liquidity. They have boxed themselves into a corner. 

The whole world has now over 280% debt to GDP ratio - Yes over 280% - thanks to Central banks and our crazy fractional banking system. Every nation is going to pay the price and the Fed has tried to perk up stock prices and has created another massive bubble in stocks and housing - it is called lather, rinse, repeat - when will these folks ever learn - that asset bubbles created from such loose monetary policies allow the folks at the top to get even richer and the lower class and middle class really do not get any benefit. Wages are stagnant and all the house buying is supported by elevated stock prices.

So did the Fed finally realize that the end is near.. and that they need to do something to stop their balance sheet from growing - did the ECB just realize that they are also complicit in perpetrating an asset bubble - just take a look at student debt, auto loan debt, and credit card debt just in the US. Consumer debt in UK, Australia and all countries is at exorbitant levels relative to income. Then there is corporate debt which has grown massively while rates have been low - will these go into default - what about the energy sector companies - will these be able to service their debt loads and their dividends?? 

The tech stocks and Nasdaq have had a massive run up and the valuations are at nose bleed levels. All these companies have manipulated earnings by doing stock buybacks and cost adjustments via layoffs and outsourcing. Real revenue growth is evident in very few companies and lot of the semiconductor companies businesses are very cyclical. Many of these stocks - specially like NVDA are trading at multiples given to very speculative companies or IPOs. We are betting heavily against NVDA and believe it is going lot lower. The daily chart shows a climax high on the day it touched its all time high of 168.5. In addition, the chart is parabolic in nature and parabolic charts never end well. We like QCOM as a better investment even though it is in the middle of some lawsuits and fighting the FTC and Apple. But their purchase of NXPI is an awesome addition to their portfolio as NXPI has huge presence in China. We do not believe the true benefits of this acquisition is reflected in the current stock price. NXPIs' RFID technology is omnipresent in China and the rest of the world (ROW) and growing. QCOM has enough cash to keep the dividend payout and if the government decides to change the tax rate on dividends then watch out and all dividend paying stocks will crash. See our video on youtube at: https://www.youtube.com/watch?v=dFC5iVaTkQY

So we think the bell on the NASDAQ and the semi stocks. We advise taking profits aggressively. All key indicators of market bullishness are at levels seen only in 1929 and 2007. 2000 bubble mania was higher and was the biggest bubble ever.

DOW stocks are doing well and it appears that energy may be bottoming here. We like CAT, DE and BA (wait to buy this one). The biotech sector still looks good but we would sell JNJ and MRK. Housing stocks look ok. Bonds are down recently - watch these closely.

Futures are pointing to a higher open for Monday Jul 3. This is very typical action prior to Jul 4th holiday. Sell into this rally any tech stocks and take profits. AAPL is still cheap but we would wait to buy at lower prices. We like NKE but keep a stop at 55. Weekly chart looks good. Chart for NKE - www.trucharts.com/stockcharts.aspx?TICK=NKE

Good luck trading. 

B. Bhatia
Founder

June 12, 2017

Friday's Nasdaq Tech Bloodbath

Blog 6/10/2017 and 6/12/2017 

Trucharts.com


Was it a tech carnage or not?? Friday was a huge rollercoaster ride but we made out really well!Well, Friday started out like a good day in the markets with many of the FAANNG stocks hitting new highs and then reversing ending lower. AMZN moved around 100 points and we were very fortunate that we had closed our puts and were long the lower puts on many stocks and all of these made us some really good profits.We have been short NVDA and are staying short - we know this is a bubble stock trading at ridiculous valuations. Many of the stocks on the NASDAQ have been going up non stop in a straight line up with almost no end in sight - it looked and still looks like the bubble of 1999-2000 with a different feel. Everyone feels invincible and like a investment pro. It is all easy to think that one is a genius in investing when making money is so easy. It is days like Fridays when folks start getting margin calls that we see selling and then everyone tries ti buy the dip. We will have to wait and see if buying this dip makes sense. 

Now there was one key thing we had noticed on Thursday even when stocks were moving higher - MSFT was acting weak and that was a sign that something was changing. Everyone in the midea and online (CNBS - Cramer) has been harping on and on about NVDA - a chipmaker which momentarily reached a market cap of 100B - yes 100B and selling at price to sales ratio of around 12+ - no semiconductor company has ever traded at such a huge multiple or valuation. Also it is very common to see when stocks are high flying that analysts and idots on TV come out and try to justify the valuations of such stocks - vocalizing terms which they have no idea about like AI and VR etc. NVDA is a chip company - end oif story and their sales will never ever reach the lofty valuation it carries. NVDA is primarily a graphics chip company with lot of competition and this is a very hyped stock. We highly recommend taking profits, if long, and we are short and long NVDA puts.So what happened Friday tech stock bubble - we think there is a shakeout that took place. Technicals are still strong and until we actually see real technical breakdowns - we have to count it as a shakeout. In addition, it would be prudent to take some chips off the table and ring the bell on profits. Many of the stocks bounced up from their 20day and 50d SMAs. Very typical when machines are running the house. We can expect some bounce but we are also seeing rotation out of tech stocks, which we mentioned have been going up in straight line fashion, into energy and other sectors. 

Financials were strong but we still think this was a dead cat bounce. We like BAC and some financials, in energy we like beaten down names like SLB for short term plays. We also like some retail names - short term trades - GPS looks good. We would short SBUX, NVDA and LRCX. Although the real technical weakness or clear breakdown is not evident yet - have tight stops above at recent high. We suspect there will be some bounce back and maybe this was just a shakeout. We will have to wait and see confirmation - as there were no breakdowns below 50dSMA. NVDA was a classic textbook climax high reversal.

Financials were looking strong as these were oversold and oil bounced with gold closing lower. We need to watch for follow through on these next week. GPS chart looks good and we are watching BABA to see if it consolidates here for a breakout.Monday was a nice bounce back day. Many good formations on charts - need to watch closely - still short NVDA.Good luck trading and checkout our video on youtube and follow us on twitter (@trucharts). We will start posting more videos on youtube on how to use our site more effectively for trading decisions. Do subscribe - it is only $10 per month for full year subscription.

B. Bhatia
Founder - Trucharts.com