Go Daddy Signup

Showing posts with label OIL.. Show all posts

June 12, 2017

Friday's Nasdaq Tech Bloodbath

Blog 6/10/2017 and 6/12/2017 

Trucharts.com


Was it a tech carnage or not?? Friday was a huge rollercoaster ride but we made out really well!Well, Friday started out like a good day in the markets with many of the FAANNG stocks hitting new highs and then reversing ending lower. AMZN moved around 100 points and we were very fortunate that we had closed our puts and were long the lower puts on many stocks and all of these made us some really good profits.We have been short NVDA and are staying short - we know this is a bubble stock trading at ridiculous valuations. Many of the stocks on the NASDAQ have been going up non stop in a straight line up with almost no end in sight - it looked and still looks like the bubble of 1999-2000 with a different feel. Everyone feels invincible and like a investment pro. It is all easy to think that one is a genius in investing when making money is so easy. It is days like Fridays when folks start getting margin calls that we see selling and then everyone tries ti buy the dip. We will have to wait and see if buying this dip makes sense. 

Now there was one key thing we had noticed on Thursday even when stocks were moving higher - MSFT was acting weak and that was a sign that something was changing. Everyone in the midea and online (CNBS - Cramer) has been harping on and on about NVDA - a chipmaker which momentarily reached a market cap of 100B - yes 100B and selling at price to sales ratio of around 12+ - no semiconductor company has ever traded at such a huge multiple or valuation. Also it is very common to see when stocks are high flying that analysts and idots on TV come out and try to justify the valuations of such stocks - vocalizing terms which they have no idea about like AI and VR etc. NVDA is a chip company - end oif story and their sales will never ever reach the lofty valuation it carries. NVDA is primarily a graphics chip company with lot of competition and this is a very hyped stock. We highly recommend taking profits, if long, and we are short and long NVDA puts.So what happened Friday tech stock bubble - we think there is a shakeout that took place. Technicals are still strong and until we actually see real technical breakdowns - we have to count it as a shakeout. In addition, it would be prudent to take some chips off the table and ring the bell on profits. Many of the stocks bounced up from their 20day and 50d SMAs. Very typical when machines are running the house. We can expect some bounce but we are also seeing rotation out of tech stocks, which we mentioned have been going up in straight line fashion, into energy and other sectors. 

Financials were strong but we still think this was a dead cat bounce. We like BAC and some financials, in energy we like beaten down names like SLB for short term plays. We also like some retail names - short term trades - GPS looks good. We would short SBUX, NVDA and LRCX. Although the real technical weakness or clear breakdown is not evident yet - have tight stops above at recent high. We suspect there will be some bounce back and maybe this was just a shakeout. We will have to wait and see confirmation - as there were no breakdowns below 50dSMA. NVDA was a classic textbook climax high reversal.

Financials were looking strong as these were oversold and oil bounced with gold closing lower. We need to watch for follow through on these next week. GPS chart looks good and we are watching BABA to see if it consolidates here for a breakout.Monday was a nice bounce back day. Many good formations on charts - need to watch closely - still short NVDA.Good luck trading and checkout our video on youtube and follow us on twitter (@trucharts). We will start posting more videos on youtube on how to use our site more effectively for trading decisions. Do subscribe - it is only $10 per month for full year subscription.

B. Bhatia
Founder - Trucharts.com

May 27, 2015

Stock Market 5/28 - Midday Update Tuesday - Trucharts.com -
Midday Market update: 5/27


Stocks are bouncing back from the drop yesterday post Memorial day holiday from a possible buy the dip philosophy and possible Greece solution. 

We doubt this move/rally and would look to sell into rallies and take profits - NASDAQ is up from the biotech stock moves and some tech stocks. We like $DE, $BIDU and went long $TIF today. Stocks getting hammered are $WDAY, $KORS and $SHAK.  We like $MO and the tobacco stocks for their dividends and would look to go long. Short gold for now.

Markets look extended still and volatility is still low. Oil is dropping. Watch SVXY and VXX.

March 1, 2015

Trucharts.com - Weekly blog week ending 2/27 - Hot Stocks to Watch

Trucharts.com Blog week ending 2/27/2015 - Markets and Hot Stocks, stocks and thoughts for the coming week

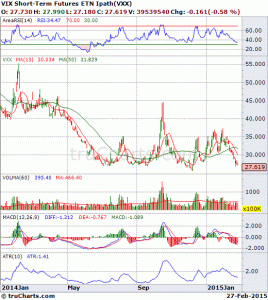
VIX dropping and the complacency is truly remarkable. Just check the chart here for VXX etf still heading down and we expect this to find a bottom and stabilize - the technicals are not pointing to any big move yet in volatility. We are heading into the sixth year of the bull market from the March 2009 bottom - earnings have been reasonable with some surprises and stocks which have beaten the estimates and raised forecasts have been rewarded their investors nicely. Check AVGO and CRM as examples. 
VXX chart:
VXX ETF Chart
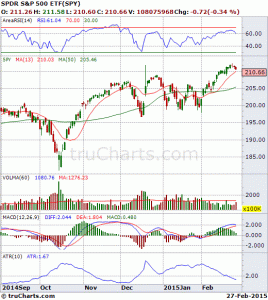
Oil dropped this week and gold stabilized around 1200 - we think gold will vacillate around 1175 - 1250 until there is an actual breakdown. We posted some good videos this week on the Fed's interest rate policy conundrum and how they have put themselves in a corner - and with the current ZIRP, we expect markets to trend higher after another consolidation phase here. A pull back to the 13 day SMA or even the 50d SMA would be a decent pullback. The leadership in stocks is narrowing and the breadth is narrowing also.  Here is the chart for SPY (check the technicals weakening RSI and MACD):

Target support is between 208 - 205 (around 2080 and 2050 for S&P500):
SPY chart
We expect oil to head down and try to form a bottom before heading higher into the summer season. Gas prices in California are still high due to some refinery shutdowns, labor strikes. We expect oil prices to stay between 40 - 55.
Greece which got its loan stay/extension - we just call it noise and the Euro is getting crushed. We are in an all out currency war now and we really like the US dollar here - as there is no other currency that is currently safe. This will impact gold prices as the USD heads higher.
Ukraine is in total disaster mode, Venezuela is sinking - Russia us struggling and China is slowing down. Japan is mired in debt and all it can think of doing is cheapen its currency.
Stocks that have triggered short signals are in the airline sector - check the chart here for DAL, UAL and LUV:
Also take a look at the chart for CAT here below:
Stocks on our list for longs are:
Additional stocks we are watching are: LLYALTR.
Our long positions with options are in the following stocks: LLY, USO, ANV, DATA, Z, TWTRANGI
As we indicated in our blog 2 weeks ago - our call on ALTR was excellent - we locked our profits based on the buy signal generated from our Fast Trading Signal Strategy. Profit was 4.5% and ALTR has hit 37 since our buy call around 34.7.
Check these trading strategies on our stock charts page at: www.trucharts.com/stockview.aspx 
Market Stats: (from finance.yahoo.com)

S&P 500: 2,104.50 -6.24 (-0.30%); Dow: 18,132.70 -81.72 (-0.45%); Nasdaq: 4963.53 -24.36 (-0.49%)

Advancers & Decliners


NYSE
AMEX
NASDAQ
Advancing Issues
1,614 (50%)
228 (57%)
1,034 (37%)
Declining Issues
1,530 (47%)
157 (39%)
1,676 (60%)
Unchanged Issues
93 (3%)
18 (4%)
91 (3%)
Total Issues
3,237
403
2,801
New Highs
99
6
105
New Lows
30
6
35
Up Volume
1,587,571,140 (45%)
87,795,645 (71%)
737,990,334 (39%)
Down Volume
1,903,862,936 (54%)
34,160,800 (28%)
1,151,918,788 (60%)
Unchanged Volume
60,957,743 (2%)
999,147 (1%)
24,153,883 (1%)
Total Volume
3,552,391,8191
122,955,5921
1,914,063,0051

Twitter handle: @trucharts; https://www.twitter.com/trucharts

Good luck trading - please check our page - Why Trucharts.com at: http://truchartscom.blogspot.com/p/why-is-trucharts.html

B Bhatia
Founder/CEO

November 2, 2014

Trucharts - Stocks to Watch - Blog Update for week ending 10/31/2014 

Another week and another major move up from such an oversold correction we had two weeks ago - now hardly anyone remembers that correction.  Not only did we recover all the losses in the pullback - the markets closed at a new high.  That is what markets do when the Fed is on their side - low rates are here to stay and markets around the world are not performing as well as the US markets.  We think there is a huge inflow from investors and funds outside of the US that are driving the markets higher. First we had a big spike in volatility during the correction, we stated that the markets will move higher and the VIX would pullback - that is exactly what we saw - in addition, Bullard spoke and then the Bank of Japan announced a round of QE to weaken the yen and bingo - Friday the markets jumped.  Japan debt to GDP ratio is over 200 but no one cares - commodities are getting crushed - along with Gold - we were wrong on our call on gold.  In one of our blogs a few weeks back we stated that gold had broken a critical trendline and sure enough we see the follow through.  We expect gold to reach $1000 now.  We shorted AEM as we stated in our updates this week.
We expect markets to consolidate and move higher with weaker technical backdrop.  We are heading into a strong period in the year for markets and into Q1 of 2015 - we do not expect any major surprises - unless there are wars and major breakdowns in the Euro zone.  The Fed has basically stopped QE but with low interest rates - they are forcing people to take risks.  Individual stocks are moving in the range of several $$ per day -  just look at the biotech stocks - these are a day traders' dream come true.  Along with this we have the internet stocks like LNKD, BIDU etc.  There are other stocks in other industries that are moving several $$ a day.  Reminds you of the 1999-2000 era.  Unbelievable..  Well take advantage of this and make hay while the sun shines - we do not expect any interest rate hikes from the Fed till middle of next year - so be happy and make money trading.
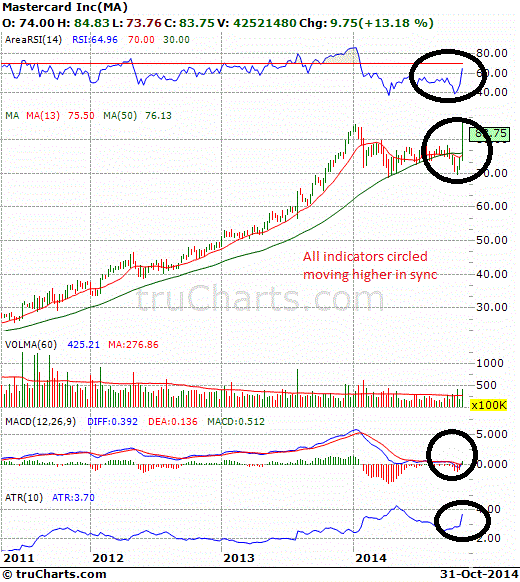
From a stocks to watch next week - here are some of our top picks this week are - AAPL, LNKD, MA and short AEM/GM at 32+.  We will go long MA and LNKD this week.  Here are the weekly charts:

We closed TUBE and GM short this past week and are still long T/USO and AAPL.  We are still short BIOTECH sector.
Here is a good lesson on technical analysis - this one is about Trend Channels:
http://finance.yahoo.com/blogs/talking-numbers/learn-trend-channels-211350606.html
We will publish an interesting sentiment indicator from our site which predicted the correction and move up these past two weeks.
Best of luck trading this week.
Trucharts team 


October 27, 2014

Trucharts.com - Markets Update - 10/27


We had indicated that markets will move higher this week and the markets were flat today.  Oil is still heading down - and the energy stocks are getting crushed - just look at some of the offshore drillers and equipment suppliers - HAL. NOV, DO, SDRL, RIG (www.trucharts.com/stockview.aspx?TICK=RIG) - just getting totally hammered.  This does not bode well - even though we think oil complex is getting extremely oversold - we wrote covered call on our USO position today.  Gold was down today - that is not a good sign for the commodity complex and the miners which have been hammered to almost ridiculous valuations.

TWTR, BWLD and AMGN reported earnings after hours.  TWTR was down almost 10% in after hours trading.  Cannot generate enough users and offered in line estimates.  BWLD and AMGN reported positive earnings - we will see how these will react tomorrow.  We had picked BWLD in our weekend blog.

Additionally we had indicated to keep on stock Alibaba - symbol BABA (www.trucharts.com/stockview.aspx?TICK=BABA) - that was up today.

We like CYBR - closed strong today - we expect that to go higher tomorrow.

We will keep an eye on VIX and the Biotech sector - a very crowded trade and now everyone is jumping on the bandwagon of the biotech sector.  


Our positions are still holding long AAPL, T and watching BABA. Expect some consolidation next week - due to heavy earnings calendar next week. Our short on GM is still looking good. 

Many biotech earnings are coming out this week.  We will have to watch these closely - the biotech stocks are very extended technically.  

Good luck trading..

trucharts team

October 22, 2014

Stock Charts - Trucharts.com 


Based on the charts we are seeing - we expect the markets to move higher here and consolidate - there are some indicators that are overextended - but we think the trend is higher and for the S&P  (as stated earlier) is to head to 1960-1970 range.  

Some stocks are looking really good from our buy signal report on our reports page under the TUHQ Fast Trade Buy SIGNALS report at: BUY Signal Reports.  Check out this very good reports page which shows our predefined scan results end of the day.  You can use the mouseover chart feature to scan through many stocks very quickly. A feature that was designed by a team of hedge fund managers.

Long AAPL, T, USO and TUBE.

Trucharts team

October 20, 2014

Market Close Update - Trucharts.com - Stock Charts - technical analysis - 10/20/2014

Trucharts.com - Brief Update - 10/20/2014


Markets closed strong today as we predicted - VIX was extremely high last week and it offered a great opportunity to sell some puts and cover shorts.  NASDAQ, SP500 closed at the highs and we are seeing a rebound in gold due to issues in Eurozone - Greek bond yields have surged higher.  This looks like it maybe a bottom for the gold miners - but we will have to see confirmation come from gold price.  Our long positions did well - T, TUBE and USO (coming off a bottom looks good) - OIL is extremely oversold and should move higher.  We expect AAPL to announce a good quarter and provide a good forecast - we will post an update on this later.

See this very interesting article below on hedge fund long exposure in the markets.

Technical Analysis - Trucharts.com - Check out this article released by BOFAML on hedge fund exposure to the markets - 

http://www.zerohedge.com/news/2014-10-20/going-q3-hedge-funds-have-never-been-more-bullish

October 19, 2014

Trucharts.com end of weekly blog update - 10/17/2014

Trucharts.com end of week Blog update 10/17/2014

What a week of market gyrations.  It had our head spinning.  We were expecting volatility – but this was nothing we have experienced in the past two years – since the markets (like we stated before) have been going up in a straight line.  The correlation between the Fed balance sheet and the markets has been moving in tandem.  And then the Fed speaks anytime the markets drop – because obviously all the Wall Street guys are concerned about their portfolios dropping and how this will impact the average investor.  Fed governor Bullard spoke and then we had some other Fed governors speak – as soon as that happened the markets jumped and bounced.  It is like a scripted movie – predictable. Bullard (non-voting member fo FOMC) stated that the Fed should keep the bond buying active – wow!! As if the Fed balance sheet is not big enough yet.  It is $4T – yes 4 TRILLION and that has created a bubble in stocks, real estate and every asset.  Bonds had moved higher into this volatility and the VIX spiked to a high of 31+ and then settled the week at 21.99. We expect the VIX to pull back and bring some sense to back for some time into the markets.  There are some interesting charts we have shown below and with comments and trendlines indicated.  We are short IBB still and GM.  We expect NFLX to pull back and since we have earnings coming up from AAPL and many big names next week – we would like to stay on the sidelines and keep our powder dry.  We went long USO even though we think the correction in the OIL/energy sector is not over.  Gold did bounce but the long term chart looks weak.  Gold miners are getting slaughtered.
We have added one of our unique sentiment indicator charts at link:  http://www.trucharts.com/MarketSentiment_ISEE.aspx
This is of VIX vs SPY500 and you can see clearly how the VIX spiked significantly last week.
We have added the charts for LUV (Southwest airlines) – position closed last week.  DAL short closed last week – even though we may retake the short positions in these later.  Our SNDK profit was 150% – Oct 92.5 puts – we bought at $4 and it closed and sold for $10 on Friday expiration.
XLE chart shows breakdown in the energy sector.
QQQ bounced exactly off the 50 week average – see chart below.
The volatility did allow day traders to take advantage of the daily moves in the markets/stocks.  One of our fund manager friend who manages a S&P futures fund made the highest return and the return for the week was a whopping 17% and the YTD  return has been 64% with a hit ratio of 96.5%.
If you are interested in discussing this with our hedge fund manager – please contact us at support@trucharts.com and or at bbhatia@trucharts.com.  Please keep in mind that the minimum investment required is $50K or $100K.  
Here is the weekly return chart for past 32 weeks.  As you can see the return is low when volatility is low – but none the less positive.


Best of luck trading next week;
Trucharts team

October 16, 2014

Trucharts.com - Markets closing brief - 10/16/2014


Trucharts.com - Markets closing brief - 10/16/2014

The markets had a very volatile day today.  VIX spiked and then pulled back.  We have been saying that the market moves will be exaggerated with VIX flirting with above 20 levels.  Stocks, obviously gyrated between being positive and negative moves - and very wide intraday moves - excellent for day traders if timed correctly.  Biotech stocks were up and down and we need to monitor the closing of these stocks, the markets and indices tomorrow.  Google announced earnings that missed expectations - stock was down after hours.  We are watching oil since it is already in a bear market with a correction of 20%+.  We took a position in USO today for a possible move up from a corrective move - but will require patience.  Stop is at 28 for USO.  

Semiconductor stocks bounced today from a correction move down after SWKS (Skyworks) after making a higher earnings/revenue announcement.  We believe the market is oversold in the short term and we would expect some type of bounce and drop in the VIX.  But we will watch this closely. 

Check out the features on our site like real time news, stock scanner, stock backtest feature, automated buy/sell signals with our trading strategies.  There is a free trial sign up period: check our subscription price and for the price of 3 cups of Starbucks coffee you can get access to our site features.  We will publish our weekly update this weekend.  Here is a chart with our buy/sell signal strategy which shows :the NFLX signal before the carnage. 

We discussed NFLX in our blog 2 days before the huge drop and here is the chart with the red down arrow showing the sell signal right before the carnage.  Carl Icahn could have also saved some headache from this drop :-)...


We are still short GM/IBB and long USO/T.

Trucharts team.

October 12, 2014

Stock Charts - Trucharts.com - Blog Update ending 10/10/14

Trucharts.com - Blog Update week ending 10/10/2014


Well what a volatile week this was.  Markets ended on a weak note on Friday.  We stated last week that volatility was high and that it would pull back - well we did get a pullback on Monday but then it moved up significantly by Friday.  There were huge moves in the markets and in oil.  Oil closed below the $85 mark.  Many oil drillers and stocks related to the oil industry are crashing and we think this well affect the Texas economy significantly.  Last week we showed some very good charts on the markets - we indicated that there was underlying technical weakness even as the markets were moving higher.  The RSI and MACD were weak and this is where techncial analysis becomes very useful. We believe that there is incessant selling in the oil stocks due to margin calls.  Just check the stock charts for APC, CLR, APA, HAL and many more.

The gold miner stocks are also getting crushed.  We still like gold - we suspect it has bottomed here for a short time - but the long term trend is showing a possible price target of $1000.  We will keep a close eye on this.
Last week there was news from Microchip (MCHP) that affected the semiconductor sector.  We had been short SNDK and SIMO.  We think this is real weakness and expect this to continue through into 2015.  Check the charts for NXPI, AVGO, LLTC, XLNX, LRCX, KLAC and many more in this sector at: www.trucharts.com/stockview.aspx.  This sector is in major correction mode as is the NASDAQ.

We indicated that we would be shorting HPQ, SNDK, GM and we took short positions in these stocks.

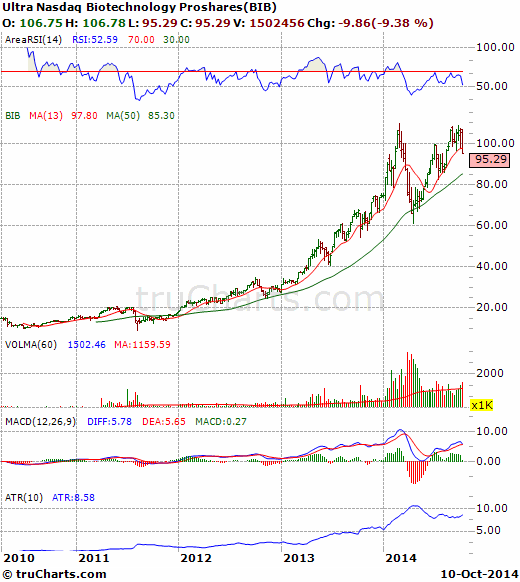
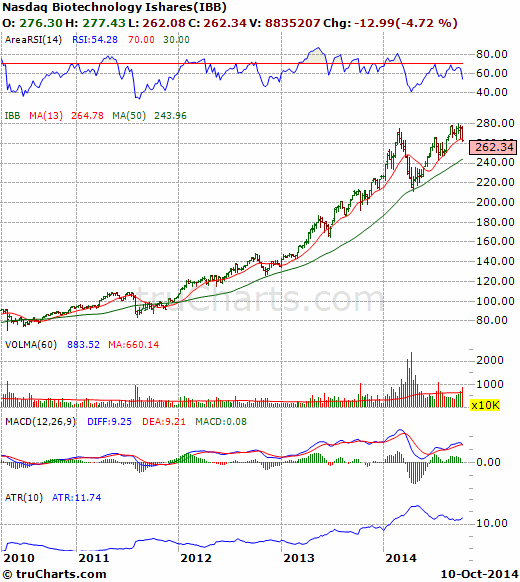
Now for the next sector which we have been indicating is in bubble mode and should see a correction or major pullback - we are long BIS and short IBB.  We have been showing these charts for the past 2 weeks.  Here is the chart for IBB and BIB - note the close belowe the 13 week average for the first time in over 12 weeks - also note the technical weakness in the RSI/MACD and volume. The next support is at the 50 week moving average.

BIB stock chart
BIB weekly close
Stock Chart IBB weekly
IBB weekly chart

September 3, 2014

truCharts.com; Stock Charts update 9/3/2014

Stock Charts - truCharts.com - Update 9/3/2014


The DJIA and the SPY are moving within a very tight range for the last few days since the close above 2000.  There may still be legs in this rally, but we advise taking profits in at least half of your positions and watch oil closely today - coming off an oversold condition - check USO and OIL - we still like these from a technical analysis point of view.  BIOTECH rally is running out of steam here - very overpriced sector and over hyped.  We will go long USO (full disclosure) end of day today and are long TUBE, BIS and YHOO.  We will publish a technical update on the indices this week and show some technical divergences.

TruCharts team
www.trucharts.com