Go Daddy Signup

Showing posts with label YHOO. Show all posts

November 1, 2015

Best October Market Rally, Do you Buy, Sell or Hold?

Best October Market Rally, Do you Buy, Sell or Hold?

Trucharts.com Blog update week of 10/26/2015


Well again due to some business commitments we were unable to update our weekly blog for over two weeks now. We are finally back and updating our readers on what has transpired and with all the financial media going nuts over the best October rally, we have to sit back and see what to do next and plan for Q4. Check out our site for the best buy/sell signals for stocks and just apply it on BABA stock and you will see why we went long at 62.. Go tot the stock charts page and click on the Trucharts Trading Strategies bar - seen in red below and you will get the different trading strategy options to apply to the chart - (please read our disclaimers - please do your due diligence and consult with your financial adviser before making investment decisions) - this is for information purposes only. We offer this to our paying and free subscribed users only. You can try this on VRX and you will see it generated a SELL signal around 220.


There is no doubt that the rally was expected. We had discussed this in our last blog and our updates via twitter (twitter handle: @trucharts) and on facebook at (https://www.facebook.com/truchartscom-273554162830234/) - we expected S&P to reach around 2100, DJIA to reach around 17800 to 18000 and that is exactly what the indices did during the October rally and with earnings season in full force - markets responded to stocks with good earnings. We believe that this is a short lived rally and even if we hit new highs, we would sell into the rallies. Markets are not significantly overbought yet so we expect some sideways movements in the indices. The Fed spoke (amazing) and now that they realize they are well behind the curve in raising rates, the again tried to spook the markets by indicating a possible rate hike for December. Markets are in bubble mode - real estate along with it and it is not just here but all around the world. We have bubble blowers and Central banks printing money while earnings from companies are drying up and not even meeting lower estimates. The Wall Street gang plays this game beautifully, lower the estimates and when the companies report slightly better results, the street starts their cheering. One has to look through the numbers - but from a technical trading point of view you just have to be ready to trade based on the earnings announcements. Here are some charts for the S&P , DJIA and a chart we pulled from a very interesting article on M&A activity which typically tends to peak around market tops.

ADDED: Another good read:
http://www.zerohedge.com/news/2015-10-31/quick-bull-vs-bear-case-8-charts

Link to article: http://finance.yahoo.com/news/ubs-beginning-end-bull-market-131106708.html 

Source Bloomberg/UBS:


From the charts below for SP500 and DJIA we expect sideways movement and possible new highs into Q4 due to a typically strong Q4 season for the markets and we would lighten up into this sideways and possible upward movement. We would not hesistate to write covered calls on long positions. We have done that already for many of our accounts. Many tobacco stocks appear overbought, so we would either sell these or hedge with puts or reduce cost basis via covered call strategy. We are long PM and LLY. Our MRK position got called away.

As you can see the MACD is getting extended as is the RSI reaching overbought conditions. But we expect this to last for sometime with minor pullbacks and sideways movements.


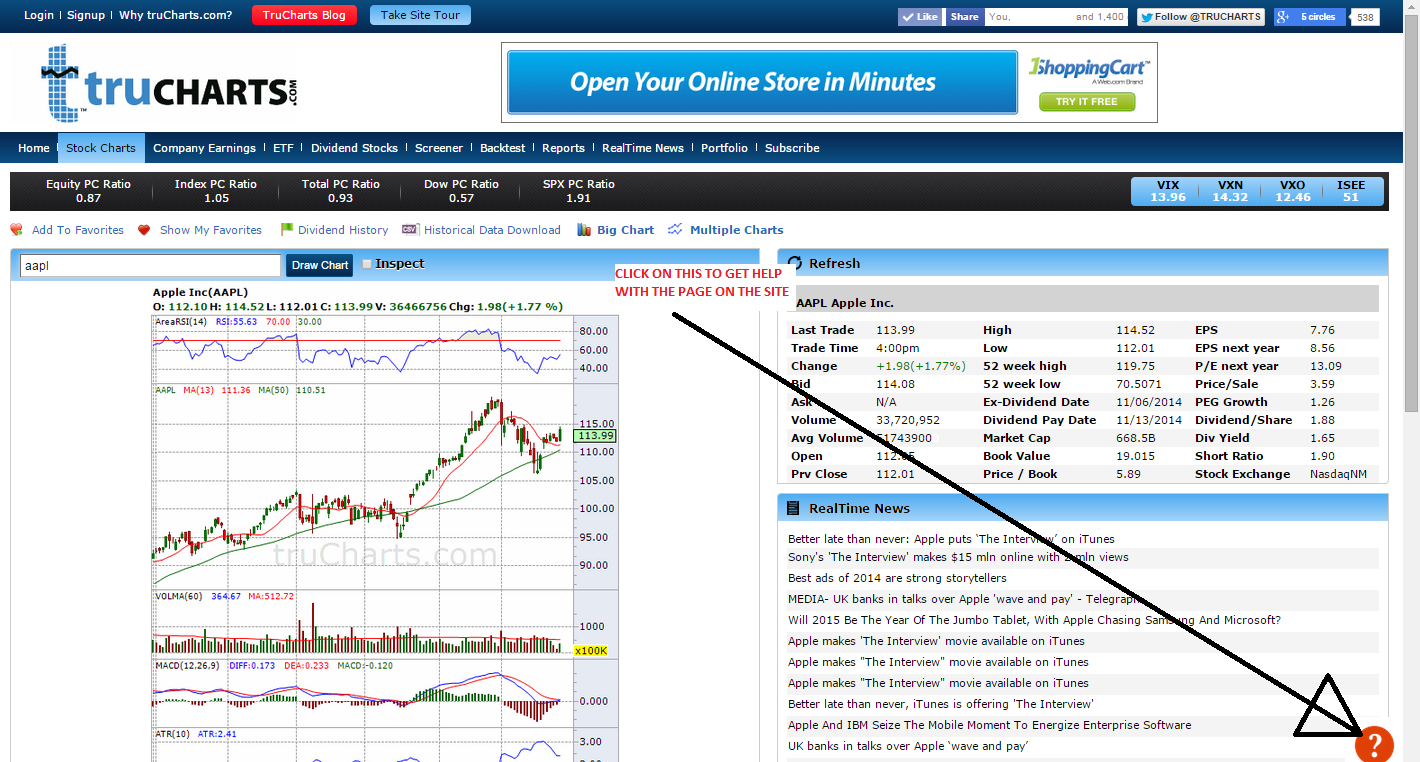
We would lighten up on biotech stocks and health insurance companies. We believe that Obamacare is a total disaster and will very likely get repealed if the GOP takes the White house. The premiums are unaffordable and we are seeing several co-ops going out of business due to high costs and then the insured are being put into a situation with no coverage and high costs. We believe this will not end well and there will be a new wave or change in the healthcare system in this nation. The current scenario is not sustainable and is designed heavily in the favor of insurance companies and drug companies. We also think these insurance companies may have reached a peak in their earnings cycle. Our net portfolio is short tech stocks. AAPL seems to have peaked and we do not expect any major move in AAPL - we still like NFLX - as Q4 is a strong season for them.

Good luck trading.

Trucharts team

January 28, 2015

Trucharts.com Market closing update - 1/28/2015


Free Stock Charts/ETFs/Dividend stocks at Trucharts.com: Auto Stock Buy/Sell signal strategies - check out our site - free 30d trial:

Well another down day after Fed speak and the techncial picture is getting weaker. Read this article - a very good read on the market technicals: http://finance.yahoo.com/news/too-already-bear-market-110124065.html.

We stated we never have our portoflio all long or all short. We were hedged but stayed with our shorts - GM, F, IBB and DAL. We closed our YHOO short early. Our long side of portfolio was hedged with covered calls and today's weak close was not a good sign. 

OIL is getting crushed and our USO position is not looking strong. We will hold on as the bearish sentiment on oil is growing day by day. We now expect that oil will go to 40 possibly. Gold was down and we are short AEM. 

The market has been going through a tug of war between the bulls and the bears and looks like right now the bulls are losing. Earnings have been mediocre and a few companies are either beating or rasing their forecasts. Majority of the forecasts have been down for this year. Well what this tells us is that the economy is going to see some challenges this year and the world economies are in for a challenge. 

The Greek anti-austerity party victory is driving up the Greek bond yields - expect some fire crackers from the Euro zone - what happens if Greece decides to break away from the Euro zone. Who is next? 

We still want to stay short GM, F and AEM. We will sit and wait tight with our USO position and average down when the dust is cleared. 2000 onthe S&P has been the line in the sand - we will have to watch this 2000 mark and see if the S&P can hold or break it.

AAPL stock was up today and YHOO pulled back - FB still looks like a great short - overvalued company.

January 19, 2015

Trucharts Blog Stock Charts Free - Week ending - 1/16/2015

Trucharts.com Blog week ending 1/16/2015. 


Happy MLK day - markets were closed today - but what a closing on Friday almost 8:2 advancers vs decliners on NYSE and NASDAQ - we suspect short covering rally and short term oversold conditions - but technically the markets look weak and we had a 13d SMA crossing the 50dSMA for the indices - we expect a bounce to the 50d SMA - we had a strong close and gold moving higher, along with oil. And then we had the Dutch cut their interest rates to -ve. SO we pay the banks money to hold cash - think about that for a second - you pay the bank to hold your money - wow!! Then there is the expectation that the ECB will unleash another round of QE - when are the idiots in the Eurozone get it through their thick skulls - QE does nothing in a heavily taxed and socialistic government structure - reduce taxes and act like Ronald Reagan and let's see what happens - really dumb people lining their pockets. So stupid.

Today China reported the GDP number - 7.4% and then yesterday the markets in China got crushed as China pricked the stock bubble by regulating margin accounts which were non-compliant to the capital requirements. Now everyone expects China to unleash another round of stimulus. The whole world and asset prices are now running on steroids - that is what I call QE and all these stimulus injections into the economy - eventually these will hurt and the central banks are scared shit. Gold is the real currency and there is now a currency war in play an oil glut and stocks/real estate in bubbles everywhere. We never seem to learn from our mistakes.

This will be the start of the earnings barrage week - check the earnings calendar on our site at: http://www.trucharts.com/EarningsView.aspx

We closed our ALTR calls last week - our call on ALTR short was correct.
DAL - we sold puts for Jan 30 for 44 strike - we are still short DA and the 44 puts, GM and F.
Our GM call spread for 34.5 and 36.5 expired worthless. Our stock K is doing well and we are long WSM, TWTR, CYBR, USO and ANV. We still like gold here because it broke through resistance and the Chinese New Year is in February.

Here are some good picks for the coming week -
XLU (www.trucharts.com/stockview.aspx?TICK=XLU); Other stocks (www.trucharts.com/stockview.aspx?TICK=SO) - the utility stocks look good in this falling interest rate environment. Our call on HELE was good - still looks strong.

Chart of GRMN here below - looks good technically for a short term trade:


GRMN stock chart

January 11, 2015

Trucharts.com - Blog and stocks to watch week ending - 01/09/2015

Trucharts.com Blog week ending 01/09/2015 - HELE, TWTR, SCO, USO

What a volatile first trading week of the year. We were negative for the year and then after the huge move up with the VIX above 20 - traders came in drove the market up over 500 points. And then on Friday we had the consolidating pull back. Even stocks like MU which guided lower revenue forecast to the analyst estimates for Q1 rallied after falling sharply. There was expectation that EU zone will unleash a QE and with nterest rates going negative in some of the EU countries - the markets rallied. In addition, we still have the Russian ruble crisis and the oil drop is definitely hurting the Russian economy, and the Venezuelan economy. The talking voices and experts on TV keep telling us that the drop in oil is due to lower demand and supply glut - I call that complete BS. This drop in oil is a politically driven - there is no way oil can drop 50% unless economies around the world are crashing - it is like saying 50% of the cars and oil consumers around the world suddenly stopped driving and the oil supply jumped by 100% - does this this sound reasonable at all. I believe oil will stabilize around 45 and move up to 70 from this very oversold rally - keep an eye on SCO the oil short ETF which is very extended - we woud look to buy puts on this ETF - check out the chart - www.trucharts.com/stockview.aspx?TICK=SCO. 

We are long USO, LINE and look to go longer in oil stocks or ETFs. We will wait for the signal. There is too much negative sentiment on oil. Surprisingly - gold and gold stocks and gold ETFs moved up last week - we think this was driven by a run to safety and the falling dollar from the extended move up.

During the rally, Advancers vs Decliners was almost 8:2 on the NYSE and the NASDAQ. Here are the numbers for the A/D and volume from Friday close:


Advances & Declines
NYSE
AMEX
NASDAQ
Advancing Issues
1,163 (36%)
202 (50%)
913 (33%)
Declining Issues
1,975 (61%)
187 (46%)
1,785 (64%)
Unchanged Issues
92 (3%)
15 (4%)
101 (4%)
Total Issues
3,230
404
2,799
New Highs
152
11
77
New Lows
63
8
54
Up Volume
985,074,941 (29%)
52,720,491 (60%)
606,206,477 (36%)
Down Volume
2,335,614,656 (69%)
32,671,019 (37%)
1,034,281,930 (62%)
Unchanged Volume
49,081,860 (1%)
2,604,305 (3%)
24,354,296 (1%)
Total Volume
3,369,771,4571
87,995,8151
1,664,842,7031

This week is start of earnings week with AA (Aloca reporting tomorrow) - check the earnings calendar on our site at: www.trucharts.com/earningsview.aspx.

Here is an excellent article on the PE and the markets this week:http://www.zerohedge.com/news/2015-01-10/permabull-throws-towel-stocks-are-massively-overvalued-key-multiples-are-post-war-re

This article tells us that we are at a critical juncture in the markets - we highly 
recommend taking some profits.

Another article: http://www.bloomberg.com/news/2015-01-12/this-guy-called-bonds-in-14-you-listening-this-time-.html?cmpid=yhoo

On our stockview page - you can see the earnings date on the top right hand side of the data box for any particular symbol. We closed our YHOO position last week and we have been watching and keeping an eye on the utility stocks. The financial stocks like BAC and others pulled back - we have no positions in these stocks.

Our long positions are AMKR, USO, LINE, WSM, CYBR, K, and TWTR. Our short positions are GM,F,IBB,DAL.

We like the following stocks for next week:

TWTR - we think the rumors of a buyout are driving the stock higher - we went long on Friday - here is the chart: Charts:


December 28, 2014

Trucharts.com - Stocks to watch and Marlets blog week ending 12/26/2014

Trucharts.com Markets Update Blog week ending 12/26/2014:

Well now we have the New Year week coming up and markets keep making record new highs. This is the highest number of new record highs hit in one year. DOW and S&P500 are still trending higher. Keep an eye on the 13 and 15 week moving averages for the stock indices and the stocks - these are very critical - you can check these on our site when you click on the week option for period on the stockview.aspx page (www.trucharts.com/stockview.aspx). There was record amount of money put into stock ETFs this past week - check this article - http://finance.yahoo.com/news/u-based-stock-funds-attract-001225961.html; There are technical indicators that look weak - like lower RSI and lower MACD on higher highs - but these are not necessarily pointing to any pullback at the present time. We are still in a seasonally strong period for equities and heading into a New Year - we do not see anything other than some minor pullbacks as we head into the earnings season. Oil seems to be trying to find a bottom here; gold bounced on Friday - we will keep an eye on this - specially due to the turmoil in the currency market in Eastern Europe (including Russia). 

We are long USO, AMKR and short AEM. Our target for gold is still 1000. There are several stocks that look strong - here are th symbols and charts -AAPL and more. We are looking to go long AAPL this week. The rules are very simple - DO NOT FIGHT THE FED and STAY WITH THE TREND. Now the Yellen put is in place and everyone does not epect any major change in the Fed' stance this comng year (till at least middle of 2015) - companies revenues are not growing based on the P/E multiples - yet these stocks keep moving higher - the average PE is being stated as low and this is happening based on significant stock buy backs being used by companies to boost their earnings and EPS. But none of these matter, since the belief is that stocks will just keep moving higher. We will stay with the trend until it breaks - (Ms Yellen (Ms Clause) will come save the day).

Here are some other symbols to watch this coming week:

For full disclosure - we are long AMKR, WSM, BIS, CYBR, K and short ALTR, DAL, YHOO, AEM (will close YHOO this week).

We added a special new feature on our site - check it out at: http://www.trucharts.com/multiplestockcharts.aspx (mulitple charts on one page)

Some good reading material: (ADDED ANOTHER GOOD ARTICLE)

Here is the picture of how to use and access help on our website with any page.
Trucharts help


Check out our special subscription offer - no more monthly recurring fees - just $90 for the full year (50% discount)- here is the link: http://www.trucharts.com/truCharts_Services.aspx

Happy New Year to all - and good luck with trading in the New Year.

Trucharts Team

December 21, 2014

TruCharts.com – Free Stock Charts – Blog week ending 12/19/2014

Trucharts.com Blog week ending 12/19/2014

For SEO: Trucharts.com – Stock Charts Free, Stock Market, Stocks, Charting, Dividend Stocks, World Markets, Technical Analysis, Market Sentiment Charts
Merry Xmas and happy holidays to all. We are in a short week of trading this week and the fireworks were on last week after Fed Speak. We did not expect any surprises from the Fed on the raising of the Fed Funds rate, and the Fed made it a point to tell the markets that it was still ok to take risks and that drove the markets to recover over a 800 points on the DOW and 100 points on the SP500. A lot of this was driven by energy stocks and since some of the stocks had dropped over 50% – there were short covering rallies and bottom fishing and a major short squeeze. BofA Merrill Lynch downgraded several semi stocks but these did not correct as much. The SP500 and DOW look like they are still in an uptrend and our indicators are still showing a trend for the markets to mover higher – after a short consolidation period. The move this past week was massive, but the volumes in some stocks was not high. 
We like XLU (www.trucharts.com/stockview.aspx?TICK=XLU) and the utility stocks as good dividend earners. Check out the charts for SO, ED, PCG and DUK. Even the REIT’s look good and some consumer staple stocks look good. We took a position in K or Kellog (www.trucharts.com/stockview.aspx?TICK=K) and USO – we believe this has finally bottomed for the short term. Keep an eye on CAT (www.trucharts.com/stockview.aspx?TICK=CAT) – we are looking to take a position in CAT. 
We have been hurt by our short position in IBB – but have been writing puts to improve our short price. Our other positions are doing OK – Long WSM, short YHOO (plan to close Monday), DAL, AEM. We are looking to go long CYBR.
There is definitely a XMAS rally going on and we expect this to last into the New Year – until the earnings season starts. AAPL (www.trucharts.com/stockview.aspx?TICK=AAPL) still looks good technically.
We added some new features to our site this week – execiting stuff:
1. MULTIPLE SYMBOL CHARTS on one page – check this feature out at: http://www.trucharts.com/multiplestockcharts.aspx
2. ICHIMOKU cloud indicator on our stockview page and turtle trade indicator
3. Added borders to our charts
Check the features out and also our page: http://truchartscom.blogspot.com/p/why-is-trucharts.html
In addition, we want everyone to take advantage of avoiding monthly recurring fees  and sign up NOW for one very low annual membership for full access for just $90/year – a 50% discount to the annual membership fees and this gives you real time categorized news and complete access to all of the site including dividend stocks etc.
Again – Best wishes for the holidays to all and a Happy New Year and good luck trading.

TruCharts Team

December 11, 2014

Trucharts.com Markets update 12/11


Free Stock Charts/Scans/Stock Screener at Trucharts.com: 12/11


Well we had huge ramp this morning - we suspect this was huge short squeeze which led to short covering. The trend is still to the 50d SMA. Oil crashed and gold pulled back. RH stock earnings drove up the retailiers and their forecast was positive. So WSM (we are long) moved up and our shorts are still holding. There was pullback towards the end of the day and the ISEE closed at 54 - one of the lowest readings in the longest time. Watch the 50d SMA for SPY. Markets are trading very technically. Fundamentals are just an excuse now. Bubbles are made of volatility, no fundamentals and lot of big moves in the markets while bears and bulls try to fight it out. We think oil should stabilize in the 55-60 range. Still holding all our positions. We hope there is now a revolt against the airlines for baggage fees - now that oil is down - they should no longer be charging these fees.


Chart for RH at:

www.trucharts.com/stockview.aspx?TICK=RH

Trucharts team

October 12, 2014

Stock Charts - Trucharts.com - Buy/Sell Signal Strategy

TruCharts.com - Auto Buy/Sell Signals using our trade strategies

Here is an example of our buy/sell signal strategy on our site - just by the click of a button:

This picture is for YHOO weekly chart - we had bought the stock based on the weekly buy signal and closed the position this past week.


September 3, 2014

truCharts.com; Stock Charts update 9/3/2014

Stock Charts - truCharts.com - Update 9/3/2014


The DJIA and the SPY are moving within a very tight range for the last few days since the close above 2000.  There may still be legs in this rally, but we advise taking profits in at least half of your positions and watch oil closely today - coming off an oversold condition - check USO and OIL - we still like these from a technical analysis point of view.  BIOTECH rally is running out of steam here - very overpriced sector and over hyped.  We will go long USO (full disclosure) end of day today and are long TUBE, BIS and YHOO.  We will publish a technical update on the indices this week and show some technical divergences.

TruCharts team
www.trucharts.com