Go Daddy Signup

Showing posts with label Hedge Fund update. Show all posts

April 16, 2015

Just Keep Buying; Just Keep Buying -

Trucharts.com - Mid week markets update:

SEO: BIDU stock, BIOTECH, Blog, Free Stock Charts, Hedge Fund update, Hot stocks, TWTR, MO, MACD charts

The markets are on edging on the verge of a breakout - and looks like now we have to catch up with the bubbles in China, India and Hong Kong - money printing eventually always leads to bubbles and all the central banks do not care - under the guise of slowing economies - money printing and 0% interest rates are driving an asset and stock bubble - the central banks will never admit it, even if it is staring it right in their faces - since they are scared shit to raise rates. This has led to property bubbles and stock bubbles - no one can tell now when this will end - but when it does - watch out below - this is totally unsustainable and complacency is becoming the norm - unbelievable. Bubbles after bubbles and the only folks making money from this are the VC's who love companies with no earnings going IPO and they cash in really good. 

For now our motto is: like the fish in the NEMO movie says -  

"Just keep buying, just keep buying" (like "just keep swimming..."). 

We closed CAT today. Our SNDK short worked well and we will close position today. We like ETSY here but want to wait for a week to buy. Still long BIDU & USO (doing very well). Our MO position is also doing good and as is TWTR.

Trucharts team

January 19, 2015

Trucharts Blog Stock Charts Free - Week ending - 1/16/2015

Trucharts.com Blog week ending 1/16/2015. 


Happy MLK day - markets were closed today - but what a closing on Friday almost 8:2 advancers vs decliners on NYSE and NASDAQ - we suspect short covering rally and short term oversold conditions - but technically the markets look weak and we had a 13d SMA crossing the 50dSMA for the indices - we expect a bounce to the 50d SMA - we had a strong close and gold moving higher, along with oil. And then we had the Dutch cut their interest rates to -ve. SO we pay the banks money to hold cash - think about that for a second - you pay the bank to hold your money - wow!! Then there is the expectation that the ECB will unleash another round of QE - when are the idiots in the Eurozone get it through their thick skulls - QE does nothing in a heavily taxed and socialistic government structure - reduce taxes and act like Ronald Reagan and let's see what happens - really dumb people lining their pockets. So stupid.

Today China reported the GDP number - 7.4% and then yesterday the markets in China got crushed as China pricked the stock bubble by regulating margin accounts which were non-compliant to the capital requirements. Now everyone expects China to unleash another round of stimulus. The whole world and asset prices are now running on steroids - that is what I call QE and all these stimulus injections into the economy - eventually these will hurt and the central banks are scared shit. Gold is the real currency and there is now a currency war in play an oil glut and stocks/real estate in bubbles everywhere. We never seem to learn from our mistakes.

This will be the start of the earnings barrage week - check the earnings calendar on our site at: http://www.trucharts.com/EarningsView.aspx

We closed our ALTR calls last week - our call on ALTR short was correct.
DAL - we sold puts for Jan 30 for 44 strike - we are still short DA and the 44 puts, GM and F.
Our GM call spread for 34.5 and 36.5 expired worthless. Our stock K is doing well and we are long WSM, TWTR, CYBR, USO and ANV. We still like gold here because it broke through resistance and the Chinese New Year is in February.

Here are some good picks for the coming week -
XLU (www.trucharts.com/stockview.aspx?TICK=XLU); Other stocks (www.trucharts.com/stockview.aspx?TICK=SO) - the utility stocks look good in this falling interest rate environment. Our call on HELE was good - still looks strong.

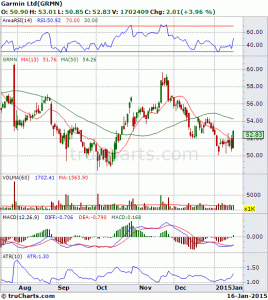
Chart of GRMN here below - looks good technically for a short term trade:


GRMN stock chart

January 15, 2015

Trucharts.com - Free stocks and Scans - Markets Update and comments - 01/15/2015


Another down day and we stated in our blog and during the weekly commentary the up move looked like a bull trap and that the markets looked precarious. Earnings are not coming in as expected - and the high expectations were reflected in the high valuations and stock prices - it was like there would be no end in sight - markets were moving up on low volume into the end of the year. 

Stocks that do not look good are BBY (Best buy), INTC (Intel), FB (Facebook) - we shorted FB today. We went long gold miners today and we stated that these were looking strong over the weekend - the gold move up was primarily due to the down move for the USD and then the SNB announcement that the Swiss Franc peg to the Euro was no longer in play - that drove gold even higher - this tells us that the Euro is doomed and it will go to par with the USD. A lot of hedge funds exploded today due to the short position in the Swiss franc. 

We showed several stocks on our blog that exhibited weak technicals and were flashing sell signals in our weekly commentary on g+ and twitter (@trucharts). We are short IBB, GM, F, DAL and AEM. Long ANV, WSM, USO, LINE, K and BIS.

Click here to access the charts on our site: www.trucharts.com/stockview.aspx

The markets for the short term have not bottomed yet and we should see some technical weakness into the earnings barrage next week. We would short BBY here and our next pick is LAD - we think the auto cycle has peaked and any stock dealing with the auto market is a short - especially dealers and manufacturers (GM, F are examples of stocks we are short). Here is the chart for LAD and it flashed a red sell signal yesterday:

Use our site for auto buy and sell signal strategy. You can save and make money using this excellent proprietary trading indicator. 


December 11, 2014

Trucharts.com Markets update 12/11


Free Stock Charts/Scans/Stock Screener at Trucharts.com: 12/11


Well we had huge ramp this morning - we suspect this was huge short squeeze which led to short covering. The trend is still to the 50d SMA. Oil crashed and gold pulled back. RH stock earnings drove up the retailiers and their forecast was positive. So WSM (we are long) moved up and our shorts are still holding. There was pullback towards the end of the day and the ISEE closed at 54 - one of the lowest readings in the longest time. Watch the 50d SMA for SPY. Markets are trading very technically. Fundamentals are just an excuse now. Bubbles are made of volatility, no fundamentals and lot of big moves in the markets while bears and bulls try to fight it out. We think oil should stabilize in the 55-60 range. Still holding all our positions. We hope there is now a revolt against the airlines for baggage fees - now that oil is down - they should no longer be charging these fees.


Chart for RH at:

www.trucharts.com/stockview.aspx?TICK=RH

Trucharts team

November 29, 2014

Trucharts Post thanksgiving blog update - week ending 11/28/2014

Trucharts Blog week ending 11/28/2014

Well what a Thanksgiving week this was. New records were set and the S&P500 had a close over it's 5d SMA for 30 consecutive trading days - a new record. Stocks closed positive for the week and then we had the energy complex stocks getting completely crushed after the OPEC announcement from Saudi Arabia - no production cuts and crude oil suffered one of the biggest drops since 2008. In line with this drop, the other commodities got crushed - gold down, copper down etc., and the big rail stocks also dropped. We indicated that, we think, this was a political move by Saudi Arabia, pressured by US, to put the pressure on Russia and Iran - whose biggest revenue comes from oil exports. Obviously this is bad for all oil producing countries and good for possibly some oil importing countries like India/Japan and others. It will help reduce their account deficits and should be good for the consumer. Tech stocks, biotech and health care stocks did well - but then pulled back at the end of the week. We think the markets are definitely extended here and the move up has been nothing short of being historical. The ISEE P/C ratio closed at 74 on Friday and we expect the markets to pull back this week. We will very likely see a drop in the commodity stocks and the energy stocks. We expect that the drop in energy prices will definitely impact the local economies of Texas, Oklahoma, Louisiana, North Dakota and the shale producers. Expect gold to drop to $1000 and below. We are staying short the gold miners that are still overpriced relative to their peers. Short AEM.

Biotech stocks are definitely in bubble state and it is not clear how long this will last. We are seeing some cracks but not there yet. Market breadth is narrow - meaning that the number of stocks moving up by sector is narrow. Consumer retail stocks should do well with oil prices dropping. GM was up - but we think this will be shortlived - auto subprime loans hit a new historical high and auto inventory for GM dealers is also very high. Along with the issues with the ignition switches, this will impact their bottom line. We are going to watch this one closely and wait for the right moment to short.
We are long QIHU, CYBR, YELP, WSM, BIS, and short AEM, DAL (with tight stops) and IBB.

Below is the link for some good reading this week - a good article on the markets and their direction.

Another very interesting article on the nature of of US consumption and our values:

Here are some charts for your enjoyment (all montly) we would short the XLE based on monthly chart:
cvx_monthlyfcx_monthlyibb_monthlyxle_monthlyxom_monthly

October 27, 2014

Our Hedge Fund Managers performance to date - Trucharts.com

Trucharts.com Hedge Fund manager update


One of the Hedge fund manager's we know has kindly been sharing with us his performance based on his trading strategies around the S&P futures - but he loves volatility and you can see why from the charts below.  This is cumulative return to date - It is truly awesome and one of the top performances in the markets this year.
TOTAL P/L$33,797.97
ACCT CAPITAL$50,000.00
TOTAL P/L %67.60%
HIT RATIO96.69%
DURATION (weeks)33
Here is the breakdown of the return by week. You can clearly see volatility is great - if you know how to play it.


If you need any information on how to invest in this fund (for accredited investors only) - drop us a line at bbhatia@trucharts.com.

Best of luck trading.

Visit Page

Trucharts CEO