
Trading/Investing Ideas/Market Commentary from TruCharts.com for stock traders/investors
Go Daddy Signup

Showing posts with label Market Sentiment. Show all posts
Showing posts with label Market Sentiment. Show all posts
August 27, 2015
Markets - UP UP and UP. VIX getting clobbered and OIL up..
Markets - UP UP and UP. VIX getting clobbered and OIL up..
Markets are up significantly for the past two days and have recovered over 1000 points on the DOW. Running into some resistance here. We expected the markets to bounce and were long some high beta stocks like NFLX, NTES and SWKS. We think the markets will stay around this level into next week. We went long BIDU for short term trade and sold/hedged our shorts with some puts and calls. We like the markets heading into tomorrow and would stay long knowing the VIX is coming down. We said pay heed to the VIX since it had exploded on Monday - and sure enough - it worked - wish we had enough cash to had bought some of the big stocks that got clobbered on Monday - we are long NFLX and MBLY. Looks like Fed made some statements regarding rates in Sept and ETF FXI looks oversold.. Always hedge..
Oil is up over 8% today - was way oversold - we still think it will bounce for short term here but long term the trend is still down.
Check out our subscription page at: (we offer the lowest subscription rate for the best feature set of any site on the web) :
http://trucharts.com/truCharts_Services.aspx
Stay nimble in trading.
Good luck.
Trucharts.com team
August 21, 2015
Markets - DOWN DOWN DOWN! - Read what we said!!
Markets --- DOWN DOWN DOWN! - Read what we said!!
Well there you have it - DOW down 530 points and NASDAQ down 171 wow!! Just go read all our blog entries and our tweets/fb posts on taking profits and hedging your positions with puts - we talked about the topping nature of the market and we covered some shorts this morning for a tidy profit - we were up all night thinking of trades to do this morning and then got the easy gift of DE (Deere) - we shorted right at the open. We have been short HAL, PYPL and IBB. We closed our IBB short call for 90% profit today - last week in our blog we picked IBB and HAL as top shorts along with PYPL and BABA, INTC, MU.
Good luck trading.. We told you so!!
Closed SWKS short.
Trucharts team
March 29, 2015
What will markets do this week? Semi Stocks, and which stocks are on our buy list
Trucharts.com Blog - What will the markets do this week - and which stocks are on our buy list?
Where are the markets headed this week? The markets exhibited volatile behavior this past week. The DOW and the SP500 ended below their respective 50d moving averages. The markets closing below the 50d SMA is a sign of weakness and with the upcoming earnings season, it would be wise to take some profits here and wait to take positions after earnings season is over. The NASDAQ held up due to the biotech bounce and the semi stocks on Friday due to takeover talk of ALTR by Intel (INTC). We expect the bounce to the 50d moving averages for the DOW and the S&P. See the charts here below for the DOW and the S&P.


In the commodity complex, gold had rallied hard due to the conflict in the Middle East and the Eurozone uncertainty with Greece. Oil moved up and then pulled back Friday after Yemen was bombed by Saudi Arabia. We think this conflict and Eurozone uncertainty will keep oil and gold volatile in the coming weeks. We think the risks in stocks is growing and we also showed a chart of the margin debt in China used for trading and buying stocks on margin - here it is again:

The Fed indicated that rates will start rising gradually from September - we believe this is coming and the markets are starting to get ready for rates to move higher. Here is an excerpt from the weekly Mauldin Economics newsletter (you can subscribe at Mauldin Economics) - an excellent writer: We call it the world on a debt binge thanks to the Fed:
Quoted as is from 'Thoughts from the Frontline' by John Mauldin
Begin Quote
There were some interesting picks we made this week:

Good luck trading.
Trucharts.com team
Where are the markets headed this week? The markets exhibited volatile behavior this past week. The DOW and the SP500 ended below their respective 50d moving averages. The markets closing below the 50d SMA is a sign of weakness and with the upcoming earnings season, it would be wise to take some profits here and wait to take positions after earnings season is over. The NASDAQ held up due to the biotech bounce and the semi stocks on Friday due to takeover talk of ALTR by Intel (INTC). We expect the bounce to the 50d moving averages for the DOW and the S&P. See the charts here below for the DOW and the S&P.
In the commodity complex, gold had rallied hard due to the conflict in the Middle East and the Eurozone uncertainty with Greece. Oil moved up and then pulled back Friday after Yemen was bombed by Saudi Arabia. We think this conflict and Eurozone uncertainty will keep oil and gold volatile in the coming weeks. We think the risks in stocks is growing and we also showed a chart of the margin debt in China used for trading and buying stocks on margin - here it is again:
The Fed indicated that rates will start rising gradually from September - we believe this is coming and the markets are starting to get ready for rates to move higher. Here is an excerpt from the weekly Mauldin Economics newsletter (you can subscribe at Mauldin Economics) - an excellent writer: We call it the world on a debt binge thanks to the Fed:
Quoted as is from 'Thoughts from the Frontline' by John Mauldin
Begin Quote
This report was underscored by a rather alarming, academically oriented paper from the Bank for International Settlements (BIS), “Global dollar credit: links to US monetary policy and leverage.” Long story short, emerging markets have borrowed $9 trillion in dollar-denominated debt, up from $2 trillion a mere 14 years ago. Ambrose Evans-Pritchard did an excellent and thoroughly readable review of the paper a few weeks ago for theTelegraph, summing up its import:
Sitting on the desks of central bank governors and regulators across the world is a scholarly report that spells out the vertiginous scale of global debt in US dollars, and gently hints at the horrors in store as the US Federal Reserve turns off the liquidity spigot….
“It shows how the Fed's zero rates and quantitative easing flooded the emerging world with dollar liquidity in the boom years, overwhelming all defences. This abundance enticed Asian and Latin American companies to borrow like never before in dollars – at real rates near 1pc – storing up a reckoning for the day when the US monetary cycle should turn, as it is now doing with a vengeance.”
End QuoteThere were some interesting picks we made this week:
- SNDK short - staying short (company forecast lower revenue for the current qtr) -
- TWTR long and still long - looking to add to our position - we like TWTR and believe that they are ready to ramp their revenue model via ads (like facebook). The weekly chart for TWTR looks good (TWTR chart).
- Took a position in BIDU at 205 and are still long with a buy-write strategy.
- Additional positions we have are short AEM, long USO.
- Position in LLY was called away due to covered calls.
Good luck trading.
Trucharts.com team
March 26, 2015
Is the market top in???
Trucharts.com - Stock Chart Free, Screener, Scans, and much more -
Remember we talked about the three 6 factor - 6th year of bull market, Iphone 6 and the Samsung galaxy 6 - and the market bottoming at 666 in 2009.. Hmmm!!!! is the top in!!
Take profits - Short SNDK.
Check these support levels for ETF IBB: 13 week and 50 week SMA have been great support before. See the two circles.

Trucharts team
March 25, 2015
Is the Semiconductor stocks run over??
Stock Charts Free at Trucharts.com - Earnings, Real time Stock News and more:
Read this: Means semiconductor stock run is over. We were saying watch AAPL closely - the inclusion of AAPL in the DOW index is bad news - typically the this happens near the top for a stock. Just see MSFT and CSCO and then these crashed after being included in the DOW Index. We think so - just check the stocks we indicated that looked extended - AVGO, NXPI, SWKS.
http://blogs.barrons.com/asiastocks/2015/03/25/tsmc-the-writing-is-on-the-wall-sell-says-maybank/?mod=yahoobarrons&ru=yahoo
Take profits now.
Trucharts.com team
March 18, 2015
Bought these hot stocks today - Markets Rally today
Market Rally 3/18/2018 - Thanks Ms Yellen - Greatly appreciated
CORRECTED LINKS..IN THIS UDPATE..Well today's Fed output (scientific term) was all but nonsense and as expected - the markets had done a classic bear trap and sucked everybody in. Our expectation was to stay net long and our picks from our blog this past week was right on the money - Euro rallied, Gold rallied, Oil rallied and the Fed will keep blowing bubbles till it learns a lesson it will never forget - till then keep partying.
We mentioned the XLU, SO, PCG, LLY and BIDU in our blog this past week and as part of our holdings - all of these stocks rallied hard today - staying long and going long more on BIDU or LLY..
Here are the charts:
www.trucharts.com/stockview.aspx?TICK=LLY
www.trucharts.com/stockview.aspx?TICK=BIDU
www.trucharts.com/stockview.aspx?TICK=XLU
www.trucharts.com/stockview.aspx?TICK=SO
www.trucharts.com/stockview.aspx?TICK=PCG
Good luck trading.
Founder/CEO
Trucharts.com
March 12, 2015
Markets Rallied Hard today and here are the reasons why
Free Stock Charts - Trucharts.com - Auto Buy/Sell Signal Strategies -
Markets rallied hard today - this was due to several factors:
1. VIX was up for the past few days
2. Dollar had rallied significantly in the past few weeks and was due for a pullback.
3. Euro rallied from an oversold condition - but this move up will be short lived with the current negative interest rate environment in the Eurozone
4. Retail Sales were down and that inspired the bulls to think that the Fed would be refrained from raising rates in June
5. Health Stocks and utility stocks were looking oversold and therefore there was a good bounce - we expect a test of 2025 on the SP500 and we went long BIDU today with a covered call strategy - we discussed this strategy in our blog yesterday.
- Check out our site for auto buy and sell signals for any stock, check out our real time news feature for before and after hours news and updates. We have technical mouseover charts for very quick technical analysis on our reports and earnings page.
Good Luck Trading.
Trucharts team
January 2, 2015
Trucharts.com Blog Update for Markets Jan 2, 2015
Stock Charts Free, Charting and Scans - Trucharts.com
Markets Update Jan 2, 2105
Happy New Year to all.
Well the market makers did what they had to do today to make the DOW positive. Even with negative economic news this morning and the apparent disaster looming in the EU - DOW ended positive for the day. OIL still heading down - we went long LINE for a short term trade - volume was almost 3.5x avg volume (they reduced dividend from 2.90 to 1.25 still a decent yield). Gold was flat and we closed out YHOO position today and went short GM after the recall news.
Low volume day - now all eyes are on next week and then the earnings barrage. We are still short DAL, AEM (up today) with covered puts and long BIS, WSM, K, CYBR, USO.
Check out our new feature for mulitple stock charts on a single page at: http://www.trucharts.com/multiplestockcharts.aspx
Trucharts team
December 4, 2014
Today's market stats 12/04
Stock Charts Free, Charting / Predefined Stock Scans at TruCharts.com
Today's market stats 12/04 - Markets closed slightly lower from yesterday's close. There was a dip in the morning and then the markets recovered due to some rumor that QE was to be announced by EU zone. The breadth was negative - more than 2:1 on the NYSE and AMEX and 6:4 on Nasdaq (Decliners vs Gainers). ISEE ratio closed at 92 indicating more puts were being traded. Tomorrow is the big jobs number - we expect around 240K+ - due to holiday hiring. We are still holding all our positions - short AEM, YHOO, DAL, IBB and long WSM, BIS, TWTR. We went long JRJC today for a short term trade.
Good luck trading
December 3, 2014
Stocks to Watch - 12/4/2014
Stocks to watch tomorrow: SLAB, MCHP, CARB, JCOM.
Here is the slab chart - good for short term trade:

Here is the slab chart - good for short term trade:
November 29, 2014
Trucharts Post thanksgiving blog update - week ending 11/28/2014
Trucharts Blog week ending 11/28/2014
Well what a Thanksgiving week this was. New records were set and the S&P500 had a close over it's 5d SMA for 30 consecutive trading days - a new record. Stocks closed positive for the week and then we had the energy complex stocks getting completely crushed after the OPEC announcement from Saudi Arabia - no production cuts and crude oil suffered one of the biggest drops since 2008. In line with this drop, the other commodities got crushed - gold down, copper down etc., and the big rail stocks also dropped. We indicated that, we think, this was a political move by Saudi Arabia, pressured by US, to put the pressure on Russia and Iran - whose biggest revenue comes from oil exports. Obviously this is bad for all oil producing countries and good for possibly some oil importing countries like India/Japan and others. It will help reduce their account deficits and should be good for the consumer. Tech stocks, biotech and health care stocks did well - but then pulled back at the end of the week. We think the markets are definitely extended here and the move up has been nothing short of being historical. The ISEE P/C ratio closed at 74 on Friday and we expect the markets to pull back this week. We will very likely see a drop in the commodity stocks and the energy stocks. We expect that the drop in energy prices will definitely impact the local economies of Texas, Oklahoma, Louisiana, North Dakota and the shale producers. Expect gold to drop to $1000 and below. We are staying short the gold miners that are still overpriced relative to their peers. Short AEM.
Biotech stocks are definitely in bubble state and it is not clear how long this will last. We are seeing some cracks but not there yet. Market breadth is narrow - meaning that the number of stocks moving up by sector is narrow. Consumer retail stocks should do well with oil prices dropping. GM was up - but we think this will be shortlived - auto subprime loans hit a new historical high and auto inventory for GM dealers is also very high. Along with the issues with the ignition switches, this will impact their bottom line. We are going to watch this one closely and wait for the right moment to short.
We are long QIHU, CYBR, YELP, WSM, BIS, and short AEM, DAL (with tight stops) and IBB.
Below is the link for some good reading this week - a good article on the markets and their direction.
Another very interesting article on the nature of of US consumption and our values:
Here are some charts for your enjoyment (all montly) we would short the XLE based on monthly chart:


November 21, 2014
Stock Buy/Sell Strategy Signals at TruCharts.com
Stock Charts Free and Stock Scans at TruCharts.com: Stock Buy/Sell Strategy Signals:
Here is the report from our trade strategy sorted by volume. These are stocks that generated a buy signal yesterday from one our fast trading strategies - check the open on all these stocks today and you will see all of them opened positive and you could have made money in these stocks.

Here is the report from our trade strategy sorted by volume. These are stocks that generated a buy signal yesterday from one our fast trading strategies - check the open on all these stocks today and you will see all of them opened positive and you could have made money in these stocks.
November 18, 2014
TruCharts.com Market closing update 11/18/2014
TruCharts.com Market closing update 11/18/2014
Markets pushed higher all day today after the housing report and general bullishness heading into the holidays. S&P 500 crossed 2050 and we stated last week in our blog that the markets are trending higher and the ISEE ratio was indicating a higher market for this week. We think the DJIA is headed to 18000 and a melt up - stocks like HD - even after reporting so-so earnings are not getting hammered - that tells us that bad news is not affecting stocks - this is typical of bull market behavior - exponential charts and low VIX along with general bullishness from the sentiment reports like AAII and investor sentiment numbers.
Gold moved higher this week - again related to the SWISS referendum - and the dollar dropping. Still not a convinving enough rally to buy gold here. We expect it to pullback soon.
Tech stocks such as ASML are breaking out, airline stocks are also doing well (oil price drop). This is definitely a trader's dream come true.
Biotech stocks moved higher today - but we think there is definitely topping action in this sector due to the volatility in the price movement - we typically see this type of price action at tops.
Check out our BUY/SELL signal end of day reports and also the BULLISH MACD crossover reports for longs and the opposite for sell/short signals.
Check out our very good sell signal using the trucharts.com buy/sell strategy for FCX. Looks really good if you had shorted FCX around 38 or so.
 |
| Trucharts.com FCX Sell Signal |
November 16, 2014
Trucharts.com Stocks to Watch and Markets Blog Update Week ending 11/14/2014
Trucharts.com Markets Blog Update Week ending 11/14/2014
Markets have been vacillating and staying within a very tight range and always moving higher into the close. The VIX gets slammed at the end of the day and the markets bounce back – even though we are seeing narrow breadth and narrow leadership in the stocks driving the markets. We have ramped very fast from the correction in October and the markets appear to be topping out here. Individual stocks have been seeing some movement – but no sector other than the transports stands out. There is no question that this is definitely a trader’s dream come true – stocks move quite nicely and smart traders (day traders and short term traders) are taking advantage of this volatility in the stocks. Take a look at the stocks like Z, AMZN, BIDU, TSLA and many more momo stocks.
Our sentiment indicators are showing that the markets will stay within a tight range and, as we stated in our earlier blogs, markets will not correct into the Thanksgiving holidays. We can expect volatility but no major moves (unless there are black swan events). The GOP is going to take some time off from their victory in the mid-term elections and come back with a fresh agenda in January and let the President take it easy for the holidays.
The move in gold this Friday looks like a BULL trap – be mindful – the trend is still down and the move in the gold miners also was not on convincing volume. We would sell into the gold rally – the move was due to the coming referendum in Switzerland for the repatriation of their gold. We do not expect this to pass, and the day the this does not pass – watch gold – we think it will drop over $100 (just our speculation). We are short AEM and will stay short. Our prediction for gold price is still at least $1000.
Our IBB short is still in play and we expect the BIOTECH unwinding to start – it started on Friday. Mutual Funds will start to take profits in this sector and will try to show good performance into the end of the year.
The China stock market is coming off a bottom and since the link with the Hong Kong stock exchange, the China ADRs have been moving up quite well. Surprisingly, we missed BIDU but we have been long JRJC (www.trucharts.com/stockview.aspx?TICK=JRJC) and are looking for stocks in the China ADRs for good buy candidates – we like WUBA – here is the chart – check the weekly and daily chart – (www.trucharts.com/stockview.aspx?TICK=WUBA). Check the weekly technicals:
Here is the chart for reference:

We have a special offer for the holidays on our yearly subscription – 50% discount – check this at the following link:
The following is the list of stocks we will be watching this week:
CYBR, WIFI, TWTR.
We are long CYBR. We closed our USO position at a loss - we were stopped out of the position. Always remember capital preservation is key.
Here is the Help file image for our real time news page:
(check this out at): http://www.trucharts.com/RealTimeNews.aspx
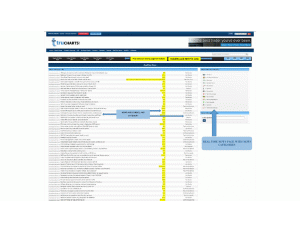 |
| Trucharts.com Realtime News Help |
November 14, 2014
Good Market Sentiment Article - Read and learn
Another excellent article: Educate the financial side of your brain -This a good article on market sentiment indicators.
http://finance.yahoo.com/tumblr/blog-is-the-rampant-bullish-sentiment-really-a-bad-thing-193745210.html
http://finance.yahoo.com/tumblr/blog-is-the-rampant-bullish-sentiment-really-a-bad-thing-193745210.html
Subscribe to:
Posts (Atom)