Go Daddy Signup

Showing posts with label Technical Analysis. Show all posts

May 23, 2021

In this video - we discuss stocks - FB,MSFT,AMZN,AAPL,GOOG,CRM - their t...

Markets update for week of May 23 and stocks FB,AMZN,GOOG,AAPL,CRM,MSFT 


What we discuss in this video:


  • Markets update for the past week
  • NASDAQ, DOW JONES and SP500 - 
  • Current expectations for markets
  • Liquidity is main driver and explicit Fed put in place – No change – Tapering talk

  • Trades for next week – Here are our picks for next week
  • BA and airline/cruise stocks + tech stocks (FB,AMZN,MSFT,GOOG,AAPL,CRM)
  • Last video picks - CAT, QDEL, Energy stocks, BBY, DD, TJX, DAL (and cruise line stocks)
  • Trades we did last week – XOM, VLO, PLCE 

  • UPS call from a month ago was a great call and still strong; Watching
  • Spread call or put writing example

November 18, 2018

Our latest thoughts on markets, Bubbles, Housing, NVDA


Our thoughts on housing, NVDA, ALGN and bubbles:


Written on 11/01:

Housing Correction coming, Bubbles, and how we held our NVDA short for over 2 years - patience is a virtue in the markets - what stocks look vulnerable and why we think HD is going to less than 50.. Well, what we expected finally happened - fortunately we were prepared for this big move down and we think more is coming - we used our indicators to monitor and these were confirmed once the move down was triggered.  We believe this pullback and move down could last longer than anyone thinks. Bear market rallies are fierce and vicious, and these tend to fool the ones who are still hanging on to their hats, praying for the move up so they can liquidate their positions which were acquired a lot higher. Unfortunately praying and hope are not the answer. 

We have shown here our short portfolio and our long/short portfolios below..

We know that there are some impeccable indicators that clearly show we were approaching a top in the markets - here they are: AMD stock - Masayoshi investing money like it grows on trees (which we guess is partially true), and ETRADE ads on TV showing trading can make one a billionaire.. Very standard ads - we live in a world where we are easy to forget the past, and repeat the same mistakes in a different form at a later time with a different group or generation of folks.. It is called wash, rinse and repeat - the big guys know it and they play the game well. Suck in everybody - make them high and drunk - then kick them out onto the road.. Works perfectly.. been there done that.

We have been warning for several weeks now that we are experiencing one of the most massive bubbles ever - ridiculous valuations - excessive risk taking with no regard for risk. Eventually someone has to pay for all this money printing. We believe the Fed has realized there is a massive bubble in stocks and is focused on pricking the bubble. Well, they are succeeding. Not a single soul and crackhead on TV has uttered the word bubble - CNBC, Bloomberg - you name it - all these assholes come on TV acting like they are gods of the stock market - everyone of them is a pump and dump ass.. Trust us - we know this very well - when one analyst came out and pumped up NVDA - all the asses on TV said it is going higher.. It is the most expensive semiconductor stock in the world - trading at over 15 time P/S - there is ZERO justification for that and guess what my favorite top of the market indicator did - that Masayoshi idiot invested in NVDA. We had shorted it all the way up at every 20% move and then also bought the long term puts. Agreed that we missed this bull run - but sometimes you have to use your gut and sit through it - trust us - we have learned patience from markets. And this mistake will never happen again.. We know how to manage such a situation much better next time around. BTW - whatever happened to that analyst - did he get fired - nope - we know that in these firms, the firms will be short the stock, and then their analysts will come and put a buy on the stock while the firm is shorting at the same time.. It is a well known technique/practice - but will never get out to the public - well now you have it.  Another one of our favorite shorts and overhyped stock ALGN - what a joke - company does 2B in revenue and market cap was over 35B - how does this make any fucking sense.. (We are allowed to cuss in our own blog!!) - I can tell you people lost their shirts in this stock as it dropped over $80 in a week and over $170 in 4 weeks. Margin calls are running around the trading desks.. We were long ALGN puts right before earnings.

Housing in Bay area - here is our open prediction - a 30% correction is coming.. We said it and are putting it in writing.. There is a 100% stocks to housing correlation in Bay Area and once all of the stocks come back down to earth - so will housing prices - we are already witnessing price reductions of over 100K in a week for eager sellers.. Unheard of again - where people were jumping over each other to overbid and paying top price of over 200K-300K on average over asking - now there are no buyers - whoever is out buying - is going to regret it very soon.. Just a 20% reduction in price will instantly eliminate all your equity.. It is coming - wait and watch. This is the main reason we think HD stock has to go to 50.. all the days of renovation and flipping are coming to an end.. The SALT and HELOC deductions will devastate the Bay Area - watch - Trump knows it. Prices are coming down in NY, Denver, Australia, Hong Kong, Canada, UAE and India.

We are short and stay short NVDA, ALGN, NOW and many more overhyped and overpriced stocks. We will buy when there is blood on the streets.. It is unfortunate that many people will end up losing (wise ones will sell and take their profits) while all the suckers who are still drunk and high at the party will be stuck with a big shock.. It is also unfortunate that the Fed and all Central bankers have made the world (along with China) addicted to bubbles.. They have not learned that human behavior does not change just because of a single or two  incidents (2000 and 2008 crash) - people will take more risk when money is flowing like water.. No one is talking about all the pension funds, government liabilities, and many more government entities that will suffer consequences of bubble markets - it is sad and it would have been better had the Fed and central bankers had taken a more gradual slow and steady approach - we might have been in a much better position. Yet they do the same - wash , rinse and repeat.. So take profits while you are up - and do not end up crying later..

We will be announcing an amazing offer for equity trading from our site directly very soon - an unbeatable offer - that will rock your brain.. It is coming - stay tuned.. and keep checking our site..which will also be completely revamped.. 

Also check our call on Chinese Yuan to USD targets on our twitter handle @trucharts where we post our trades and our previous blogs. 

BTW - sell AMZN and we are short NFLX.

Short portfolio link on Twitter handle - (@trucharts)

      https://twitter.com/trucharts/status/1063793651552182272

Long portfolio:


Good luck trading..

Founder/CEO/Team at Trucharts.com   


July 22, 2018

Our thoughts on the Tech Bubble and the everything bubble

The EVERYTHING Bubble:

It has been a long time since we published our last post. We have had a huge Trump rally since the election and the markets ramped in straight line. The FANG stocks have been the biggest contributors to the gain in the S&P along with the small cap indices hitting new highs.

Stocks like ALGN, NOW along with many others are trading at valuations that defy even the loftiest imaginations. ALGN is trading at a PS ratio of 18.8 (that is we are paying 18x times for every dollar in revenue - absolutely mind boggling numbers).  In addition, there is no shortage of companies being funded by VCs at valuations that put the 2000 bubble to shame. Just recently DoorDash received a funding of 535M - that is over HALF A BILLION DOLLARS for a company that delivers food from restaurants.

Think about it - $535 M!! These mind boggling numbers are all a result of the non stop money printing from the Central Banks - the Fed, BOJ, ECB and the PBOC along with many other central banks. This is reminiscent of the 2000 bubble but above and beyond that. Real Estate is in another bubble - and everyone thinks that this will never stop or prices will never move lower. We all know that is not possible - there are limits to everything - simple motto - nothing goes up forever and nothing goes down forever.

Many of the DOW stocks are in downtrends - check stocks like CAT, DE - http://www.trucharts.com/stockcharts.aspx?tick=CAT
http://www.trucharts.com/stockcharts.aspx?tick=DE

The DOW is being held up by stocks like AAPL, UNH, BA and MSFT. Jeff Bezos has now become the richest person on earth - in a span of 2 years is net worth has moved over 100B - Bill Gates is not even close - think about it - one guy's net worth has crossed over 150B!!! Just in a span of less than 4 years. And yet the TV bobble heads are mesmerized by all of this - not a single talking head wants to say it is a bubble - SNB (Swiss National Bank - yes a bank) along with BOJ are buying stocks - when did banks start buying stocks - unheard of - yet folks it is happening.. Just take a look at some of the exponential charts we had exhibited in our last article and many of these stocks have been moving sideways but still at lofty levels. NVDA still trading at 13 times sales.. No revenue growth in many companies - yet the stocks keep trading at these lofty levels - that is called a BUBBLE.

We have central banks that are enamored by bubbles and bubble behavior - it is like being drunk and high - that feeling lasts only so long. Then we will get to the hangover. Stock buybacks are shrinking the pool of shares available and thereby help companies do financial engineering to goose up their EPS. But this is now a trading market and no longer a investing market - we strongly suggest keeping tight stops at the 100d SMA or 10% below the 50d SMA. Try to take some profits and have at least 30% in cash ready to invest. This has been a crazy market and it is now time to take some money off the table and wait for everything to unfold. We still like gold as a hedge - it has been moving in a tight range between 1200 and 1350 - we would nibble into gold and invest 15%-20% of investable assets.

SP500 has been moving sideways in a consolidation pattern and we have to wait and see what happens in terms of a breakout or breakdown. But is very tradeable - specially ETFs like SPY and SSO, along with the QQQ'. Rates will be going higher, so bonds should be moving down. Sell NFLX and look to short the semiconductors ETF SMH. The FANG stocks - are racing to the TRILLION dollar market cap - just think the FANG stocks are worth over $4.1T!!!

We will all be witnessing history here.. Keep your eyes and ears open.. but always learn when it is time to say - yes I have made a very good return and now it is time to take it to the bank..

Check out our site - our screener is excellent and also do subscribe - checkout our pages - we offer features above and beyond other sites:
http://www.trucharts.com/stockcharts.aspx
Subscribe
Dynamic Screener

Good luck trading..

Founder/CEO (trucharts.com) - Co-Founder (Jetstox.com)

November 12, 2017

Kink in the market's armor - Is the pullback coming from these lofty levels??


Kink in the market's armor - Is the pullback coming from these lofty levels??


Are we starting to see a kink the market's armor. Was the 1 year anniversary of the election a mark of a short term or a long term top? What should we expect going into the end of the year and heading into 2018?

Exponential moves in many stocks as been very characteristic of this move in the markets. There has been narrow leadership and everyone, just like in the year 1999-2000, has been loading up in tech stocks and tech stock funds. It seems like we never learn from previous bubble manias and even though we are truly in a bubble with stocks trading at valuations not seen since 2000 and even the market multiples for many metrics above and beyond 1929, 2000 and 2007, none of the analysts (who by the way are in no way responsible for their recommendations) are NOT telling their clients to take profits and wait for better prices. Short covering has also extended many of the popular stocks and obviously the FAANG stocks along with some others in the market - keep flying high. Financial engineering, stock buybacks and earnings manipulations have become a way of keeping prices elevated. The level of complacency is unbelievably striking - there is no respect for risk. 

Every person you speak to thinks that there will never be a financial crisis or a major pullback in the markets. Personally, I believe in simple math and that there is always a reversion to the mean and trust me the mean is way below where the markets are. Typically 50d, 100d and 200d SMA are very critical in determining where the markets should find as support levels. Bubbles in real estate (many house flipping shows on TV - similar to 2007),  bond bubble (scares the shit out of me) and along with the stock bubble is mind numbing. The funding of startups day in, day out, is also a stark reminder of the days of 1999-2000. Startups that will vaporize and end in total losses will be the norm soon. 

Everyone thinks they are an investing genius and there is no way they will lose - that is when you have to take a contrarian view of the markets. Folks willing to fund companies like SLACK (nothing unique), WeWork, and many others at valuations that make your head spin has become norm and every next investor is trying to better up the next one by showing who is boss. This is NOT normal. 

The Fed and central banks around the world will be responsible for the next pullback and it will not be pretty. Market capitalizations of many companies are at mind boggling levels and unheard of. Some market capitalizations dwarf GDPs of certain countries and yet everyone thinks we are going higher. We think it is a serious time to start looking into taking profits and buying some protection in certain high flying stocks and sectors (semiconductor being at the top of the list).  

We suggest looking at puts for Jan 2019 for stocks like ALGN, ISRG and some other high flying stocks like RACE, NVDA and many others. Keep an eye on HYG and JNK - these are he ETFs related to the high yielding and junk bonds - these are pulling back and have a very good correlation coefficient to the market indices. 

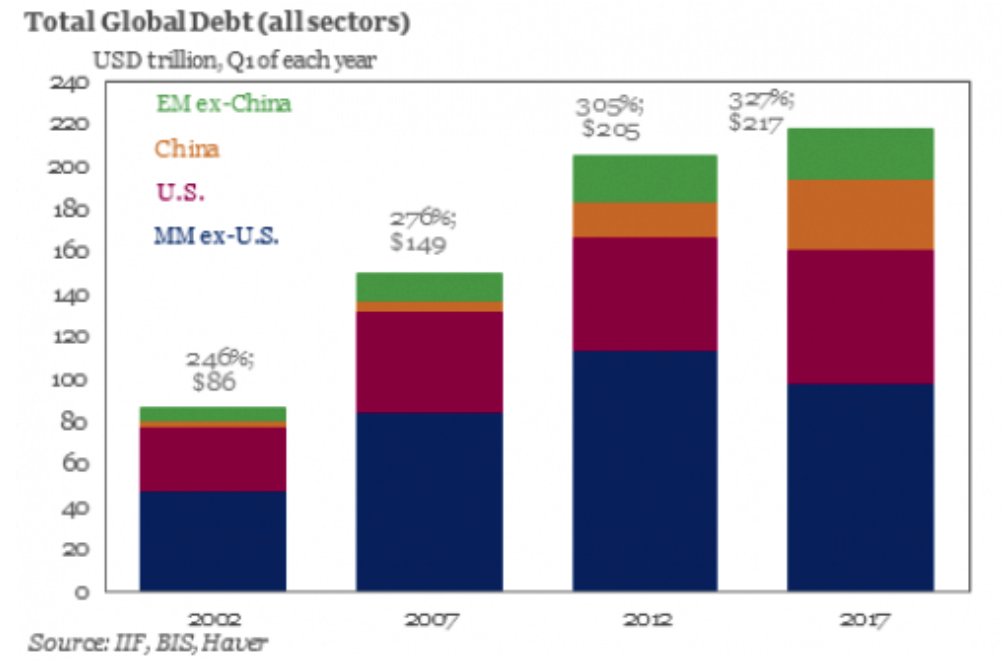
Consumer debt is at all time highs - credit card debt is now at over $1T - yes that is a T.... Car loans, housing debt and HELOCS, student loans are at all time highs. We are a world in debt and it is all going to end badly.

Debt/GDP ratios for China is at a staggering 280% and going higher - and other nations debt/gdp ratios are also at staggering highs - all this debt has been created in one decade. The central banks have managed to print so much money that it dwarfs everything we have printed in over  100 years - they have managed to do it in 10 years - that tells you why we are in a bubble. Japan markets are being driven higher because the government is buying stocks - can you believe that - government buying stocks!!! it is the quintessential final nail in the coffin or basically giving up on the basic equations of economics - normal market cycles and following simple rules of the law of numbers and laws of supply/demand and demographics.


Charts for: DIA, LRCX, ALGN and NVDA below: EXPONENTIAL MOVES NEVER END NICELY. We recommend taking profits aggressively.
DIA LRCX chart


Here some article links for your reading:


Yearly subscription is only $180 and you can also get access to our automated trading algorithms and if you enter your portfolio - you will get portfolio emails at end of day indicating the technical picture of your stocks and whether these are buy, hold or sell. Only for paying subscribers.


Good luck trading.

CEO/Founder - Trucharts.com


June 27, 2017

Mr. Market, Yellen, Gold, Tech stocks and bubbles

Markets, Yellen, Fed, gold, Tech stocks and bubbles

Well another week and Monday markets were up and all the bulls were running around predicting that the markets were headed higher. Sure enough we had a down week last week and Grandma Yellen's move to tighten is still being partially ignored by the markets. TLT or bonds were moving higher with yields moving down. We like TLT and have been long since 120. Check the chart here:


There was a heavy rotation into the biotech stocks this past week. The move in the biotech ETFs such as XBI, IBB and BIB were excellent and look like weekly breakouts. We expect these to move higher based on their weekly chart patterns. Check these charts below and we would expect a pullback before we would take any long positions.

Weekly charts:


We believe the rotation is coming out of tech stocks and moving into alternate investments that have been lagging. There is no question that we are in a bubble mode for all assets - the question is, when will this bubble burst. Over 90% of the tech stocks are trading at ridiculous PEs and valuations (that are above the 2000 stock bubble). 

Even with Fed tightening, central banks around the world are still in easing and loose monetary policy mode. 

Gold has been bouncing around this level between 1200 - 1330 for quite some time. Technicals are negative and we have to see a decisive break above the weekly moving averages of 13, 50 and 100 to turn bullish. We do not see that happening unless there is a monetary crisis a.k.a China Yuan or some other country currency crashing.

In the tech stocks we like, QCOM and WDC. These stocks relative to their peers are cheap and have good dividends and low PEs. We also like Alibaba - BABA, TWTR (if weekly close above $19.5) and would short NVDA. Please keep tight stops at 5% below 50d SMA or 20 week SMA. You can find these values on our site when you plot the charts on the www.trucharts.com/stockcharts.aspx page. 

We have added new features such as customizable multiple screener for various technical signals on our site under "Screener" menu option - check it out.  

We have video tours of our site on how to use the site effectively - please do check it out.

We have a discounted subscriber pricing which is at $10 per month or $120 annually. Please check this out on our subscriber page.

Good luck trading.

B. Bhatia
Founder/CEO - Trucharts.com


June 20, 2017

Fed meeting, gold, tech stocks and where we are headed


Fed Meeting - Fed stance, Gold and Where markets are headed


So the Fed meeting was over last week and they raised the rates by 0.25bp. In addition, indicated that they need to start winding down their balance sheet. Whoa!! Is Grandma Yellen and the Fed waking up to the scenario that they are the primary cause of the bubble - well surprise, surprise - they and all Central banks have co-ordinated this massive bubble and they have no idea how to truly unwind it. Stocks are trading at ridiculous valuations and at levels above the 2007 peak. The 1999-2000 peak was a real bubble of truly massive proportions - but we are now in an all out massive bubble in all assets except gold (maybe).

Tech stocks are valued at the highest EV/Sales ratio, high PE's and the insiders are cashing out. Does that sound familiar? Right now machines are trading and there we believe will be the catch 22 and the main risk. We can tell via our intraday charts when machines kick into the trades. Right now machines are running the show and there is very little human intervention. In addition, complacency is running at lows and we expect this to stay this way possibly through the summer.

We had predicted that the DOW stocks would hit new highs and many of the big names are hitting new highs. Our prediction of Dow 21500 was met this week and we do not see any reason for now that would not allow it to move higher.

We trade on technicals and these seem to be working very well - as we think the machines are programmed to work on technical signals. This is another reason to use our reports page to identify stocks that meet certain technical criteria.

So which stocks do we like - and how does one protect your portfolio.

Based on our analysis, we are seeing a move into the Dow component stocks and big names. We still like AAPL as it is cheap 0 but we would wait for a nice pullback before taking a position. We like BA, MDT, JNJ, CAT and DE. These are looking strong. 

We would take profits in tech stocks as we thinkthe tech cycle and bubble is over and although we may see signs of a rebound - we would sell into the rallies. There is definite rotation going on and tech is not the place to be at least for the summer or until the IPHONE 8 announcement happens. We are short NVDA and will stay short. We are long puts on NVDA also. 

We believe that the Fed is on a tightening and liquidity draining from the system and this will result in a profit taking in tech stocks as these are overvalued on all key parametrics - except for AAPL. In addition, please keep tight stops at around 8% to 10% or at 5% below 50d SMA depending on your buy price.

Check out our site - we offer AI based trading algorithms with clear buy/sell signals, end of day technical reports which work great to find good stocks to trade or buy.

We do not like gold as the Fed is in tightening mode and draining liquidity.

Good luck trading. 

Check out our site tour youtube video at -  

June 7, 2017

S&P and all indices at records - Wow Trump did have a huge impact on markets. Where do we go from here?


Welcome to the era of Trump and record high markets:

First of all, I wanted to apologize from being away so long from writing my blogs. Due to personal medical reasons, I was unable to keep my blog updated.

Well, we are definitely in the record books for sure. All indices at all time highs, financials were up, airlines up - everything is and has been going up. Financials did pull back from their highs after the Trump agenda does not seem to be materializing. But tech stocks - unbelievable run - all semi stocks, NVDA, AMD and many others are trading like it is 1999. Many amateurs are jumping into the market and let me tell you, I lived through 1999-2000, cashed out at the top - and this is looking like deja vu all over again - maybe to slightly smaller extent. Stocks are trading at sky high valuations and nobody cares, the media just keeps priming the pump and the bubble - along with the Fed.

It has been a nice run and we are still not seeing any real technical weakness - except in the financial stocks. AMZN, GOOG, FB, NFLX (or FANG stocks) along with TSLA are trading at valuations that are the GDPs of many nations combined together. I think it is getting crazy - but make hay while the sun shines. There is no regard for risk or risk aversion and therefore one as an investor or trader needs to make sure they have their stops in place. This is a good time to have one foot out the door. 

There is no question that this is a liquidity driven bubble, the Fed and all central banks are driving this bubble with no regard for the debt and market valuations. You can tell you are in a bubble when the markets and certain stocks bounce back to new highs even on bad news - mind you there has really been no real growth in revenue - there has been financial shenanigans and financial engineering to create wonderful rosy outcomes. Huge stock buybacks, and setting expectations low with the analysts community - and then during earnings season beating the estimates - sounds like a nice scam to me. But the SEC is powerless entity and they just play along. 

Anyway, we think there is still room at the top. With all this talk (no action) about tax reform, health care reform, infrastructure - well Mr. Trump does not seem to get that this is not like erecting a skyscraper - or just making a golf resort - this is the government and the government does not run like a business - and you cannot run it like a reality show - he just loves showmanship. Anyway, back to the markets.

So we like the following stocks - AAPL, WDC, PANW, INTC, QCOM - there are many others, but we are being opportunistic in our trades and watch for new highs and breakouts. We also look at the technical end of day reports from our site at www.trucharts.com/marketreports.aspx - look for RSI less than 30, improving RSI, TC Positional Buy signals and MACD crossover reports. 

The unemployment picture is not looking good - debt at consumer level is at record highs and this is already impacting the retail sector - obvious from the store closing and stock prices. Leadership is narrow and housing is looking like a major bubble - rides along with stock prices. 

We are in a bull market and heading higher into the IPHONE 8 season and going long AAPL is a good trade. Keep good stops and wait for our next update soon.


Good luck trading.

Trucharts.com
Founder


September 27, 2015

NASDAQ,DOW and SPY where are these headed? What to do with your portfolio? Trucharts Weekly Blog

Trucharts Weekly Blog

NASDAQ,DOW and SPY where are these headed? What to do with your portfolio?


Sorry that we were unable to publish our blog last weekend due to some family commitments. Well the Fed speech impact was short lived and then volatility picked up in the past week and the biggest standout was the biotech sector which had driven up the NASDAQ to its 2000 highs and everyone on TV was still bullish on biotech sector. As much as we like some stocks in the drug sector and the biotech sector, the valuations were not justified - in addition, we were seeing heavy insider selling in many companies. Many biotech companies with no revenues were showing exponential charts and if you recall how we warned about exponential charts - these always are a bad sign of things to come. Just check out some of the high flyers in the biotech sector. We were also seeing weakening technical signals in the ETF IBB when it was hitting new highs.


Check these stocks:

www.trucharts.com/stockview.aspx?TICK=BLUE
www.trucharts.com/stockview.aspx?TICK=ICPT

and then there are many more in this sector that would move on the smallest drug news. Absolutely ridiculous. We have been saying to keep and eye on the 50 week SMA for ETF IBB (which we have been short), and sure enough once it broke the line in the sand it cascaded down and now it is a pure short. We are stil short but we are long BIS (short ETF) which closed for the first time above 50 week SMA - here is a comparison chart (IBB vs BIS). Check the BIS volume - highest ever.

We also have the chart here for the buy/sell signals for IBB on weekly chart - see below (this feature is provided to our registered/subscribed users). We think IBB is headed to around 260 - 280 range. There will be margin calls on folks who are long biotech stocks.


Now where do we think the markets are headed - gold moved up after Godmother Yellen spoke on Thursday that rates would rise in 2015 and markets were up in on Friday early and then pulled back later in the afternoon. We believe the institutions are moving into the comfort of consumer cyclicals, staples and high divided yielding stocks in sectors that are still strong. We are concerned that we may see dividend cuts in the stocks of oil companies - just a guess - but with oil down - there is no way these companies can sustain such high payouts. In addition, we expect massive layoffs and the oil states economies will be affected (Texas, Louisiana and others). We like NKE after their earnings report. We hav been playing with NFLX and are short FIT/GPRO (valuation too high). We expect the DOW to stay range bound 15000 - 17000 for some time here, SPY is headed to around 1750 - current price is 192.85. We would be very careful here - SPY and DIA have broken 100 week SMA. 

China slowdown has now shown up in 2 major equipment suppliers - JOY and CAT. CHina is definitely slowing down and we have to see if they are headed the way of Japan. In addition, the central banks are still running loose with money printing and it seems to be helping the top 1% only. Brazil is going to the dogs with its credit rating cut. The rates for 10 year bonds in Brazil have shot up to 16% - want buy some Brazil debt - anyone? We would stay away from these stocks. We like gold stocks - but we need to see high volume breakout - we are not there yet. We encourage to write covered calls on your positions - that is what we have done and that has protected our portfolio. The trend is down. The ony thing in favor of the indices is the RSI is oversold - but needs to consolidate. Here is weekly chart for SPY:


Check out our site features at the best subscription rates in the industry and on the web:


Good luck trading.

Stay nimble.

Trucharts Team and Founder/CEO


August 21, 2015

Markets - DOWN DOWN DOWN! - Read what we said!!

Markets --- DOWN DOWN DOWN! - Read what we said!!


Well there you have it - DOW down 530 points and NASDAQ down 171 wow!! Just go read all our blog entries and our tweets/fb posts on taking profits and hedging your positions with puts - we talked about the topping nature of the market and we covered some shorts this morning for a tidy profit - we were up all night thinking of trades to do this morning and then got the easy gift of DE (Deere) - we shorted right at the open. We have been short HAL, PYPL and IBB. We closed our IBB short call for 90% profit today - last week in our blog we picked IBB and HAL as top shorts along with PYPL and BABA, INTC, MU.

Good luck trading.. We told you so!!

Closed SWKS short.

Trucharts team


July 19, 2015

What will markets do this earnings season - trucharts.com blog weekend edition and update

What will markets do this earnings season - trucharts.com blog weekend edition and update:

Well we had the big down move and then the earnings season started - VIX was elevated and the shorts or bears were thinking they had the upper hand - but maybe it was too early and too easy. Like they say when it is too good to be true then... The bears are probably licking their wounds - it is never good to be taking hefty positions in one direction or the other upon the dawn of earnings season, and last week, we think bears were caught off guard and this bubble growing bigger last week. Stocks like NFLX and GOOG/GOOGL killed the bears moral. We think many people were short these stocks into the earnings for these companies.

ADDED: We do not like the semi sector here - there is definitely a slowdown in this sector.

Gold is dropping like a rock - we predicted around 1000/oz and that is where we are headed - this is a bad sign seeing gold dropping - long term implications are not good - but this can be expected since markets are going up and the sentiment is in favor of the markets going up. The scenario is playing out like the 1999-2000 bubble - where stocks kept going up - real estate was going up (like now) and people stopped taking the refuge in gold and gold dropped to $200/oz and then rallied into 2008-2009 to 1900 per oz. We think we should wait on gold to bottom out and the markets topping action to complete its cycle. The bears have not thrown in the towel yet and the NASDAQ is now leading the markets - sounds like 1999-2000 - well a repeat is here. 

How can we forget about Greece - well the government and the leaders caved in and we know that the finance minister resigned because Tsipras was going break his own word. Now Greece maybe saved and the Germans averted their egotistical Euro but we think this is not the end - with many other countries to follow.. Sell out Tsipras.. 

Fed will raise rates this year and quickly ramp this into the new year - rents and housing are moving fast and the Fed does not want this to get out of hand..

The internet stocks are trading at ridiculous valuations - again - check the market caps of all the major movers last week - FB, GOOG and NFLX. Biotech is still moving up and the breadth in the overall markets is very weak - that means that leadership is very narrow and only a small section of the overall market stocks are moving higher. There is very good evidence of a bubble scenario here - stocks up, real estate up and the Fed is still at 0% rate. You can clearly see this in the ETF and stock charts below: Do you see a pattern here??  SPY bounced nicely off the 50 week SMA.


Looks like the bubble is still intact.

Just check the charts for IBB,NFLX,NKE,UA,NEU and there are many others like these. YUP there is no bubble. 

Next week over 450 companies will be reporting earnings - AAPL,MSFT,IBM,MMM and many others. We think the NASDAQ is taking the lead here from the internet and biotech stocks and the biotech bubble is still not ready to burst. These are great trading vehicles. We expect the DJIA to stay range bound and the SPY to track the NASDAQ - VIX dropped to below 12 and the stocks were coming off an oversold condition and the technicals like MACD, RSI and SMAs still are pointing to a move up.

We closed our INTC short and are short AMBA,AEM and long BIDU,CYBR,WBA and V,
WBA Chart: www.trucharts.com/stockview.aspx?TICK=WBA 

We like BIDU here - coming off a bottom and oversold condition - earnings are on 7/23.

Check out our site and we have the best buy/sell signals on daily and weekly charts - no other site offers this feature and we will be now limiting access to paying subscribers very soon.

Good luck trading and focus on hedging your positions with options - we do that for all our positions.

Trucharts Team

Stock Charts Free - Trucharts.com - Technical Analysis, MACD, ETFs, Dividend stocks, Charting, Chart, Best Charting sites, Free Charts, Stock Signals Strategies:

May 31, 2015

Markets Direction - Up or Down? Where are we headed? Trucharts.com Blog Update

Markets Direction - Up or Down? Where are we headed? Weekend Blog Update week ending 5/29/15

We have not had a chance to do a weekend update due to the jet lag from travel and other pressing matters. Finally getting some time to put my thoughts down related to the markets from the past 3 weeks and heading into the summer session.

Well NASDAQ hit a new high, markets moved higher and many earnings were reported. Avago bought Broadcom - a $37B acquisition (we think they paid too much - almost 5.5x sales) and then we have Intel buying ALTR this week - from an earnings we had HD, LOW and many other companies that reported earnings in the past couple of weeks. ULTA also reported but the stock reversed after reporting its earnings as did HD. There is talk of additional mergers in the semi company space - here are the companies that we think are ripe for consolidation - MXIM, IDTI, TXN, SLAB, MCHP, ADI, NVDA, AMD, SWKS, MRVL, XLNX, AMBA and probably many others we are missing.  Keep an eye on these stocks. NXPI, AVGO, INTC and other big semi companies would be possible acquirers. With the AVGO and BRCM merger - the merged company will be the 3rd largest semiconductor company after INTC (1) and QCOM (2).

Our drug stock picks LLY, MYL and TEVA still holding strong. The biotech sector has been holding the NASDAQ up and we expect that this sector will eventually fall - we just cannot predict when - there is technical weakness in the ETFs in the biotech sector.

We are very concerned about the underlying weakness in the markets - structurally. We are seeing many stocks breaking down in the DOW and S&P500. In addition, stocks are reversing after reporting earnings - check HD, ULTA. Housing stocks are dropping - indicating that the markets are anticipating rate hikes from the Fed. We think the Fed sees an asset bubble and are being left with no choice but to start raising the Fed funds rate. Housing prices are moving up. unemployment is down to 5.3%, homes on the west coast are selling at prices higher than asking - and this has been the longest period for the rates being at near zero - now close to 6+ years and over the past week we posted an article on FB and G+ where Byron Wein discusses how the Fed has pumped over $3T into the markets - we concur. And then we see this article over the weekend:

All these are pointing to over valuation in the markets and the complacency is remarkable. The VIX was down last week and we expect this to spike higher in the coming weeks. We stated that we would take profits here and hedge positions with calls and puts. Adding some shorts is in our plan for the coming week.  We are long BIDU, TWTR, Z (all hedged with covered calls) and are looking to short MSFT, and possibly IBM. 

Just take a look at the stocks that popped on our sell signal strategy here:Just sort the page by volume from highest to lowest by clicking on the volume column twice: 

Watch for our regular daily posts and positions updates on Twitter and FB.

Again - watch the Greek situation, China stock bubble, and sell here to take some profits and wait for a better opportunity.

Good luck trading. Check out our special subscription rates and we offer the best feature set on the web for our lowest subscription rates - here is the link: 

Do checkout our backtest feature - it is the fastest on the web and ummatched by any site.
Link is: Backtest feature - play with it and you can use it to try some paper trades.

Please help by spreading the word of our site.

Trucharts founder and team

April 8, 2015

3 weeks and 15% return on one stock - how did we do it!!

Trucharts.com - covered call buy-write strategy BIDU stock - 


Free Stock Chart, Scans and best features of any stock charting site on the web:


How we made a 15% return in 3 weeks..

Our return of 15% on BIDU - bought stock at 205 - wrote weekly covered calls for two weeks $5.00 each - these expired worthless and then we wrote another covered call for this week for $5 - total credit was for $15.00 (for three weeks) and if stock gets called away Friday 4/10 we would end up making $1500 on ($10250) investment (50% margin). Awesome 15% return!! 

UPDATE : OUR STOCK CALLED AWAY ON FRIDAY APRIL 10.

Chart here: www.trucharts.com/stockview.aspx?TICK=BIDU

Trucharts team

March 31, 2015

Are you buying or selling? We are selling..

Trucharts.com - Free Stock charts - MACD charts & Technical Analysis

Markets pulled back today giving up most of the wonderful gains yesterday - a bull trap. We stated to take profits in the rally and hedge your positions. We are heading into earnings season and be ready for some nasty surprises from the tech sector for Q2 earnings, and energy sector earnings. Gold has been dropping and oil has been pushed down to a potential nuclear agreement with Iran and what this will do the current glut situation. Biotech stocks were getting clobbered today and we think this is profit taking in this sector by the mutual funds for end of quarter performance numbers. The biotech sector has been moving up in an exponential fashion and we are still short IBB. Be prepared - we are already in the sixth year of this bull market and expect a pullback and maybe a meaningful is coming. Check out our automated trading strategies on our site to see if your stock is on a buy/sell signal. We are long TWTR. and short SMH.

In addition, we are recommending selling AAPL. 

UPDATED:

Read this: Our theory of a top forming.


http://www.zerohedge.com/news/2015-03-31/april-anxiety-75-year-itch

Trucharts Team

March 1, 2015

Trucharts.com - Weekly blog week ending 2/27 - Hot Stocks to Watch

Trucharts.com Blog week ending 2/27/2015 - Markets and Hot Stocks, stocks and thoughts for the coming week

VIX dropping and the complacency is truly remarkable. Just check the chart here for VXX etf still heading down and we expect this to find a bottom and stabilize - the technicals are not pointing to any big move yet in volatility. We are heading into the sixth year of the bull market from the March 2009 bottom - earnings have been reasonable with some surprises and stocks which have beaten the estimates and raised forecasts have been rewarded their investors nicely. Check AVGO and CRM as examples. 
VXX chart:
VXX ETF Chart
Oil dropped this week and gold stabilized around 1200 - we think gold will vacillate around 1175 - 1250 until there is an actual breakdown. We posted some good videos this week on the Fed's interest rate policy conundrum and how they have put themselves in a corner - and with the current ZIRP, we expect markets to trend higher after another consolidation phase here. A pull back to the 13 day SMA or even the 50d SMA would be a decent pullback. The leadership in stocks is narrowing and the breadth is narrowing also.  Here is the chart for SPY (check the technicals weakening RSI and MACD):

Target support is between 208 - 205 (around 2080 and 2050 for S&P500):
SPY chart
We expect oil to head down and try to form a bottom before heading higher into the summer season. Gas prices in California are still high due to some refinery shutdowns, labor strikes. We expect oil prices to stay between 40 - 55.
Greece which got its loan stay/extension - we just call it noise and the Euro is getting crushed. We are in an all out currency war now and we really like the US dollar here - as there is no other currency that is currently safe. This will impact gold prices as the USD heads higher.
Ukraine is in total disaster mode, Venezuela is sinking - Russia us struggling and China is slowing down. Japan is mired in debt and all it can think of doing is cheapen its currency.
Stocks that have triggered short signals are in the airline sector - check the chart here for DAL, UAL and LUV:
Also take a look at the chart for CAT here below:
Stocks on our list for longs are:
Additional stocks we are watching are: LLYALTR.
Our long positions with options are in the following stocks: LLY, USO, ANV, DATA, Z, TWTRANGI
As we indicated in our blog 2 weeks ago - our call on ALTR was excellent - we locked our profits based on the buy signal generated from our Fast Trading Signal Strategy. Profit was 4.5% and ALTR has hit 37 since our buy call around 34.7.
Check these trading strategies on our stock charts page at: www.trucharts.com/stockview.aspx 
Market Stats: (from finance.yahoo.com)

S&P 500: 2,104.50 -6.24 (-0.30%); Dow: 18,132.70 -81.72 (-0.45%); Nasdaq: 4963.53 -24.36 (-0.49%)

Advancers & Decliners


NYSE
AMEX
NASDAQ
Advancing Issues
1,614 (50%)
228 (57%)
1,034 (37%)
Declining Issues
1,530 (47%)
157 (39%)
1,676 (60%)
Unchanged Issues
93 (3%)
18 (4%)
91 (3%)
Total Issues
3,237
403
2,801
New Highs
99
6
105
New Lows
30
6
35
Up Volume
1,587,571,140 (45%)
87,795,645 (71%)
737,990,334 (39%)
Down Volume
1,903,862,936 (54%)
34,160,800 (28%)
1,151,918,788 (60%)
Unchanged Volume
60,957,743 (2%)
999,147 (1%)
24,153,883 (1%)
Total Volume
3,552,391,8191
122,955,5921
1,914,063,0051

Twitter handle: @trucharts; https://www.twitter.com/trucharts

Good luck trading - please check our page - Why Trucharts.com at: http://truchartscom.blogspot.com/p/why-is-trucharts.html

B Bhatia
Founder/CEO