Go Daddy Signup

Showing posts with label Stocks Blog. Show all posts

July 22, 2018

Our thoughts on the Tech Bubble and the everything bubble

The EVERYTHING Bubble:

It has been a long time since we published our last post. We have had a huge Trump rally since the election and the markets ramped in straight line. The FANG stocks have been the biggest contributors to the gain in the S&P along with the small cap indices hitting new highs.

Stocks like ALGN, NOW along with many others are trading at valuations that defy even the loftiest imaginations. ALGN is trading at a PS ratio of 18.8 (that is we are paying 18x times for every dollar in revenue - absolutely mind boggling numbers).  In addition, there is no shortage of companies being funded by VCs at valuations that put the 2000 bubble to shame. Just recently DoorDash received a funding of 535M - that is over HALF A BILLION DOLLARS for a company that delivers food from restaurants.

Think about it - $535 M!! These mind boggling numbers are all a result of the non stop money printing from the Central Banks - the Fed, BOJ, ECB and the PBOC along with many other central banks. This is reminiscent of the 2000 bubble but above and beyond that. Real Estate is in another bubble - and everyone thinks that this will never stop or prices will never move lower. We all know that is not possible - there are limits to everything - simple motto - nothing goes up forever and nothing goes down forever.

Many of the DOW stocks are in downtrends - check stocks like CAT, DE - http://www.trucharts.com/stockcharts.aspx?tick=CAT
http://www.trucharts.com/stockcharts.aspx?tick=DE

The DOW is being held up by stocks like AAPL, UNH, BA and MSFT. Jeff Bezos has now become the richest person on earth - in a span of 2 years is net worth has moved over 100B - Bill Gates is not even close - think about it - one guy's net worth has crossed over 150B!!! Just in a span of less than 4 years. And yet the TV bobble heads are mesmerized by all of this - not a single talking head wants to say it is a bubble - SNB (Swiss National Bank - yes a bank) along with BOJ are buying stocks - when did banks start buying stocks - unheard of - yet folks it is happening.. Just take a look at some of the exponential charts we had exhibited in our last article and many of these stocks have been moving sideways but still at lofty levels. NVDA still trading at 13 times sales.. No revenue growth in many companies - yet the stocks keep trading at these lofty levels - that is called a BUBBLE.

We have central banks that are enamored by bubbles and bubble behavior - it is like being drunk and high - that feeling lasts only so long. Then we will get to the hangover. Stock buybacks are shrinking the pool of shares available and thereby help companies do financial engineering to goose up their EPS. But this is now a trading market and no longer a investing market - we strongly suggest keeping tight stops at the 100d SMA or 10% below the 50d SMA. Try to take some profits and have at least 30% in cash ready to invest. This has been a crazy market and it is now time to take some money off the table and wait for everything to unfold. We still like gold as a hedge - it has been moving in a tight range between 1200 and 1350 - we would nibble into gold and invest 15%-20% of investable assets.

SP500 has been moving sideways in a consolidation pattern and we have to wait and see what happens in terms of a breakout or breakdown. But is very tradeable - specially ETFs like SPY and SSO, along with the QQQ'. Rates will be going higher, so bonds should be moving down. Sell NFLX and look to short the semiconductors ETF SMH. The FANG stocks - are racing to the TRILLION dollar market cap - just think the FANG stocks are worth over $4.1T!!!

We will all be witnessing history here.. Keep your eyes and ears open.. but always learn when it is time to say - yes I have made a very good return and now it is time to take it to the bank..

Check out our site - our screener is excellent and also do subscribe - checkout our pages - we offer features above and beyond other sites:
http://www.trucharts.com/stockcharts.aspx
Subscribe
Dynamic Screener

Good luck trading..

Founder/CEO (trucharts.com) - Co-Founder (Jetstox.com)

November 12, 2017

Kink in the market's armor - Is the pullback coming from these lofty levels??


Kink in the market's armor - Is the pullback coming from these lofty levels??


Are we starting to see a kink the market's armor. Was the 1 year anniversary of the election a mark of a short term or a long term top? What should we expect going into the end of the year and heading into 2018?

Exponential moves in many stocks as been very characteristic of this move in the markets. There has been narrow leadership and everyone, just like in the year 1999-2000, has been loading up in tech stocks and tech stock funds. It seems like we never learn from previous bubble manias and even though we are truly in a bubble with stocks trading at valuations not seen since 2000 and even the market multiples for many metrics above and beyond 1929, 2000 and 2007, none of the analysts (who by the way are in no way responsible for their recommendations) are NOT telling their clients to take profits and wait for better prices. Short covering has also extended many of the popular stocks and obviously the FAANG stocks along with some others in the market - keep flying high. Financial engineering, stock buybacks and earnings manipulations have become a way of keeping prices elevated. The level of complacency is unbelievably striking - there is no respect for risk. 

Every person you speak to thinks that there will never be a financial crisis or a major pullback in the markets. Personally, I believe in simple math and that there is always a reversion to the mean and trust me the mean is way below where the markets are. Typically 50d, 100d and 200d SMA are very critical in determining where the markets should find as support levels. Bubbles in real estate (many house flipping shows on TV - similar to 2007),  bond bubble (scares the shit out of me) and along with the stock bubble is mind numbing. The funding of startups day in, day out, is also a stark reminder of the days of 1999-2000. Startups that will vaporize and end in total losses will be the norm soon. 

Everyone thinks they are an investing genius and there is no way they will lose - that is when you have to take a contrarian view of the markets. Folks willing to fund companies like SLACK (nothing unique), WeWork, and many others at valuations that make your head spin has become norm and every next investor is trying to better up the next one by showing who is boss. This is NOT normal. 

The Fed and central banks around the world will be responsible for the next pullback and it will not be pretty. Market capitalizations of many companies are at mind boggling levels and unheard of. Some market capitalizations dwarf GDPs of certain countries and yet everyone thinks we are going higher. We think it is a serious time to start looking into taking profits and buying some protection in certain high flying stocks and sectors (semiconductor being at the top of the list).  

We suggest looking at puts for Jan 2019 for stocks like ALGN, ISRG and some other high flying stocks like RACE, NVDA and many others. Keep an eye on HYG and JNK - these are he ETFs related to the high yielding and junk bonds - these are pulling back and have a very good correlation coefficient to the market indices. 

Consumer debt is at all time highs - credit card debt is now at over $1T - yes that is a T.... Car loans, housing debt and HELOCS, student loans are at all time highs. We are a world in debt and it is all going to end badly.

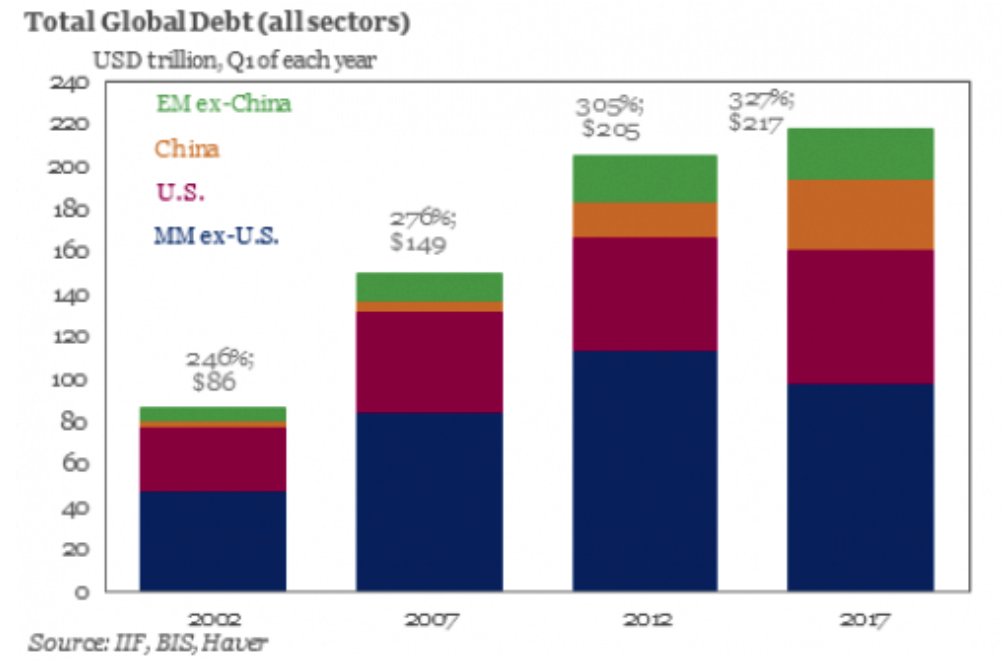
Debt/GDP ratios for China is at a staggering 280% and going higher - and other nations debt/gdp ratios are also at staggering highs - all this debt has been created in one decade. The central banks have managed to print so much money that it dwarfs everything we have printed in over  100 years - they have managed to do it in 10 years - that tells you why we are in a bubble. Japan markets are being driven higher because the government is buying stocks - can you believe that - government buying stocks!!! it is the quintessential final nail in the coffin or basically giving up on the basic equations of economics - normal market cycles and following simple rules of the law of numbers and laws of supply/demand and demographics.


Charts for: DIA, LRCX, ALGN and NVDA below: EXPONENTIAL MOVES NEVER END NICELY. We recommend taking profits aggressively.
DIA LRCX chart


Here some article links for your reading:


Yearly subscription is only $180 and you can also get access to our automated trading algorithms and if you enter your portfolio - you will get portfolio emails at end of day indicating the technical picture of your stocks and whether these are buy, hold or sell. Only for paying subscribers.


Good luck trading.

CEO/Founder - Trucharts.com


August 21, 2015

Markets - DOWN DOWN DOWN! - Read what we said!!

Markets --- DOWN DOWN DOWN! - Read what we said!!


Well there you have it - DOW down 530 points and NASDAQ down 171 wow!! Just go read all our blog entries and our tweets/fb posts on taking profits and hedging your positions with puts - we talked about the topping nature of the market and we covered some shorts this morning for a tidy profit - we were up all night thinking of trades to do this morning and then got the easy gift of DE (Deere) - we shorted right at the open. We have been short HAL, PYPL and IBB. We closed our IBB short call for 90% profit today - last week in our blog we picked IBB and HAL as top shorts along with PYPL and BABA, INTC, MU.

Good luck trading.. We told you so!!

Closed SWKS short.

Trucharts team


April 19, 2015

Was it a market Correction? Or the start of something bigger?

Market Correction or is the market going to crack here?

Markets on Friday pulled back and broke the 50d and 13d SMA from the wedge pattern we discussed in our last blog. The NASDAQ closed above its 50d SMA. Here are the charts with critical short term trendlines. We expect support for SP500 around 2048 area and for the DOW around 17450. For NASDAQ, around 4850. These will be short term critical support areas. 

There was news on new housing starts which was not good heading into the peak home buying spring season and the housing stocks - check (www.trucharts.com/stockview.aspx?TICK=LEN as an example). Then we had news from Greece and possible default, then the news of the slowdown in China growth and the stock market bubble - investors opened over 4.8M accounts in one week - think about that number 4.8M in one week - Wow!! China is experiencing the same bubbles we had in the US - stocks bubble, housing bubble and then now again stock bubble. There are bubbles brewing everywhere and now for the first time San Francisco median price crossed $1M - this is what happens when money printing machine is running non-stop.


Check the trendlines for the DOW, SP500 and NASDAQ. Watch the levels closely. We have been in a sideways consolidation pattern after the breakout in Oct of 2014. There have been breakouts, but the markets have still been in a sideways pattern. Support for DOW is around 17000, SP500 support is at 1980 area.


With the earnings season in full force there have not been too many surprises - PM raised forecasts and the tech companies have had lackluster earnings - even the forecasts have been muted. We think this is the peak of the tech cycle. 
We are looking to short XLK (www.trucharts.com/stockview.aspx?TICK=XLK
and/or SMH/IPGP (www.trucharts.com/stockview.aspx?TICK=IPGP) for the short term. 

There is a another set of earnings barrage coming next week and the week after - IBM, AAPl, TWTR, YHOO and many more - check this link on our site for the earnings calendar: http://www.trucharts.com/EarningsView.aspx?qst3=qstthisweek.

Our all long portfolio was down only 0.1% on Friday even though the markets were down over 1% each and our long/short portfolio was up 0.5% on Friday. We hedge all our positions and our TWTR position was called away on Saturday. We are long MO, USO, BIDU, TWTR. Short positions are AEM, IBB and SNDK position closed on Saturday.

Check out our special susbscription rates for full access - our features are bar none the best of the web - we are aware of other sites that charge just $35 per month for the real time news feature. Here is the link to our subscription page and our site features:

http://www.trucharts.com/truCharts_Services.aspx

http://truchartscom.blogspot.com/p/why-is-trucharts.html

Good luck trading.

Trucharts Team


February 15, 2015

Trucharts.com Blog - week ending 2/13/2015 and Stocks to Watch

Trucharts.com Blog week ending 2/13/2015

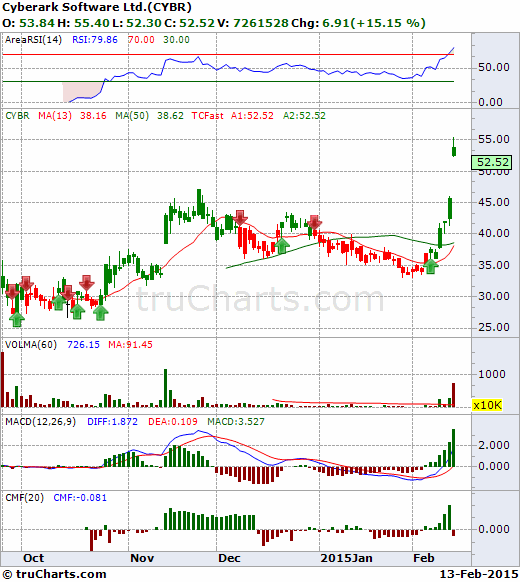
Happy Valentine’s day to all and after a short travel hiatus, we are back to writing our blog. Due to blogging restrictions in China, we were unable to post to our G+, FB and blogger/WP. It feels weird when you cannot blog about just something simple as stocks. Anyway, it has been an exciting week after what we call a consolidation period in the markets. The S&P,NASDAQ and the DOW all hit an all time high – we were expecting the breakout based on the wedge pattern/descending triangle pattern that started in Nov. We expect this to move to last based on the recent earnings and the oil sector bouncing back. Gold pulled back and we expect gold to move down – we think the move up was due to the Chinese New Year. The Greek crisis is just noise and we do not expect this to impact the markets. Oil is in a bottoming phase and we will watch this closely – our picks LINE, USO and OIL jumped very nicely (over 30% for LINE and OIL etf), our GM short and F short will be rolled over to next month. We expect this to be a peak year for auto sales. Our pick CYBR did very well as did TWTR – both of these are up over 40% CYBR and 20% TWTR since our calls and check out the buy signal for CYBR on our buy/sell strategy chart below:

Check the Chaikin money flow Index on the bottom of the chart – it went negative when the stock gapped up on Friday. Based on our technical analysis, we would expect the stock to pull back/consolidate and make a move higher. The earnings were announced on Thursday after the close and the company crushed the earnings and guided higher.
CYBR Stock Chart

CYBR _ WITH BUY/SELL SIGNALS

TWTR also reported good earnings and that moved higher and we are still expecting a move higher in TWTR. 

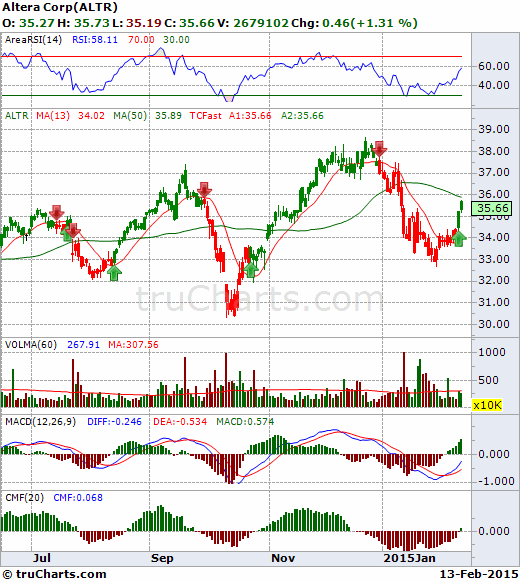
We went long ALTR based on the technicals. Here is the chart for ALTR. We will exit the position this week around 36.25 or better.

ALTR Stock Chart
We went long AMKR, are long USO/LINE and are watching the following stocks closely next week:

http://www.trucharts.com/stockview.aspx?TICK=VFC (which went buy signal right before the gap up)
Markets are closed for President’s day – Monday. Good luck trading and check out our multiple charts feature and also our real time categorized news feature.

We closed our position in K (Kellogg) right before it gapped down on Friday – looks like people are not eating enough cereal!!

Our call on DAL short was right on the money - we closed that position this week.

Trucharts Founder

February 9, 2015

Delayed Blog posting due to travel and restrictions

To all:

Due to my personal travels for the past two weeks and travel to China - my blog has not been updated due to bloggin restrictions in China - we will be posting a big update later today - just a brief update on our calls on oil and the ETFs for oil (USO and OIL) these have moved up sharply from our recommendations and as has TWTR which really worked very well for us. We have been long USO and LINE which have moved up over 10% and 30% in the past week and TWTR has moved over 20%. We will discuss these and many other things during our blog update later today.  Good luck trading and watch BOX stock.

Trucharts Founder/CEO

January 28, 2015

Trucharts.com Market closing update - 1/28/2015


Free Stock Charts/ETFs/Dividend stocks at Trucharts.com: Auto Stock Buy/Sell signal strategies - check out our site - free 30d trial:

Well another down day after Fed speak and the techncial picture is getting weaker. Read this article - a very good read on the market technicals: http://finance.yahoo.com/news/too-already-bear-market-110124065.html.

We stated we never have our portoflio all long or all short. We were hedged but stayed with our shorts - GM, F, IBB and DAL. We closed our YHOO short early. Our long side of portfolio was hedged with covered calls and today's weak close was not a good sign. 

OIL is getting crushed and our USO position is not looking strong. We will hold on as the bearish sentiment on oil is growing day by day. We now expect that oil will go to 40 possibly. Gold was down and we are short AEM. 

The market has been going through a tug of war between the bulls and the bears and looks like right now the bulls are losing. Earnings have been mediocre and a few companies are either beating or rasing their forecasts. Majority of the forecasts have been down for this year. Well what this tells us is that the economy is going to see some challenges this year and the world economies are in for a challenge. 

The Greek anti-austerity party victory is driving up the Greek bond yields - expect some fire crackers from the Euro zone - what happens if Greece decides to break away from the Euro zone. Who is next? 

We still want to stay short GM, F and AEM. We will sit and wait tight with our USO position and average down when the dust is cleared. 2000 onthe S&P has been the line in the sand - we will have to watch this 2000 mark and see if the S&P can hold or break it.

AAPL stock was up today and YHOO pulled back - FB still looks like a great short - overvalued company.

January 13, 2015

What a day!!! - closing remarks 1/13/2014

Well it sure felt like Friday the 13th today. Markets were up and then pulled back completely. We think it was a bull trap and people are very concerned about the upcoming earnings reports and forward guidance. With oil dropping and the commodity sector (at least for now except gold) falling - looks like there maybe some rough riding here. These type of moves happen when there is tug of war between the bears and the bulls. TIF (Tiffany got massacred yesterday) - Crappy stock SNDK got killed - they were getting the benefit of a bull market and we think the semiconductor run maybe over. Please take profits in this sector until the 2nd half of the year comes around. Technically, today was a bearish day - see chart below for DIA and SPY. You will see lower RSI , lower MACD and the DIA/SPY closed 50d SMA. ALmost looks like a bearish wedge pattern.

We think oil has reached the bottom of its range - we will watch it here carefully and try to establish a position in USO.

We hope to see some good results from the retailers - we will keep an eye on that.
We will close our ABBV position tomorrow - should have closed it today.

We are long AMKR,WSM,K,CYBR,USO and LINE. Short GM,F,AEM,DAL,IBB. We always hedge our portfolio with options and not be all long or all short.


Check out our site and you can clearly see our auto buy/sell signals for your stocks.
GPRO and MU were on the sell signal list 4-5 days ago.

Trucharts team

January 11, 2015

Trucharts.com - Blog and stocks to watch week ending - 01/09/2015

Trucharts.com Blog week ending 01/09/2015 - HELE, TWTR, SCO, USO

What a volatile first trading week of the year. We were negative for the year and then after the huge move up with the VIX above 20 - traders came in drove the market up over 500 points. And then on Friday we had the consolidating pull back. Even stocks like MU which guided lower revenue forecast to the analyst estimates for Q1 rallied after falling sharply. There was expectation that EU zone will unleash a QE and with nterest rates going negative in some of the EU countries - the markets rallied. In addition, we still have the Russian ruble crisis and the oil drop is definitely hurting the Russian economy, and the Venezuelan economy. The talking voices and experts on TV keep telling us that the drop in oil is due to lower demand and supply glut - I call that complete BS. This drop in oil is a politically driven - there is no way oil can drop 50% unless economies around the world are crashing - it is like saying 50% of the cars and oil consumers around the world suddenly stopped driving and the oil supply jumped by 100% - does this this sound reasonable at all. I believe oil will stabilize around 45 and move up to 70 from this very oversold rally - keep an eye on SCO the oil short ETF which is very extended - we woud look to buy puts on this ETF - check out the chart - www.trucharts.com/stockview.aspx?TICK=SCO. 

We are long USO, LINE and look to go longer in oil stocks or ETFs. We will wait for the signal. There is too much negative sentiment on oil. Surprisingly - gold and gold stocks and gold ETFs moved up last week - we think this was driven by a run to safety and the falling dollar from the extended move up.

During the rally, Advancers vs Decliners was almost 8:2 on the NYSE and the NASDAQ. Here are the numbers for the A/D and volume from Friday close:


Advances & Declines
NYSE
AMEX
NASDAQ
Advancing Issues
1,163 (36%)
202 (50%)
913 (33%)
Declining Issues
1,975 (61%)
187 (46%)
1,785 (64%)
Unchanged Issues
92 (3%)
15 (4%)
101 (4%)
Total Issues
3,230
404
2,799
New Highs
152
11
77
New Lows
63
8
54
Up Volume
985,074,941 (29%)
52,720,491 (60%)
606,206,477 (36%)
Down Volume
2,335,614,656 (69%)
32,671,019 (37%)
1,034,281,930 (62%)
Unchanged Volume
49,081,860 (1%)
2,604,305 (3%)
24,354,296 (1%)
Total Volume
3,369,771,4571
87,995,8151
1,664,842,7031

This week is start of earnings week with AA (Aloca reporting tomorrow) - check the earnings calendar on our site at: www.trucharts.com/earningsview.aspx.

Here is an excellent article on the PE and the markets this week:http://www.zerohedge.com/news/2015-01-10/permabull-throws-towel-stocks-are-massively-overvalued-key-multiples-are-post-war-re

This article tells us that we are at a critical juncture in the markets - we highly 
recommend taking some profits.

Another article: http://www.bloomberg.com/news/2015-01-12/this-guy-called-bonds-in-14-you-listening-this-time-.html?cmpid=yhoo

On our stockview page - you can see the earnings date on the top right hand side of the data box for any particular symbol. We closed our YHOO position last week and we have been watching and keeping an eye on the utility stocks. The financial stocks like BAC and others pulled back - we have no positions in these stocks.

Our long positions are AMKR, USO, LINE, WSM, CYBR, K, and TWTR. Our short positions are GM,F,IBB,DAL.

We like the following stocks for next week:

TWTR - we think the rumors of a buyout are driving the stock higher - we went long on Friday - here is the chart: Charts:


January 9, 2015

TWTR stock at Trucharts.com and more

Trucharts.com - TWTR stock


As we indicated yesterday, we went long TWTR today - we think this is headed to 42.

Markets pulled back today - should be expected after such a huge run - we think the retail news from GPS (Gaps) and BBBY (Bed Bath and beyond) was not good - but we will keep an eye out for retail stocks. 

We are short GM, F, IBB, DAL.

We are long TWTR, CYBR, K, USO, LINE, WSM.

Gold stocks were moving higher today.

There is a very interesting divergence going on between gold and oil and the commodity complex - we suspect this maybe due to the currency weakening in the Eastern Block and other countries vs the USD. The junior gold miners are seeing some heavy buying activity - is gold going to go up this year?

Check out our market reports page at: www.trucharts.com/marketreports.aspx - this helped us pick TWTR.

January 6, 2015

Trucharts.com Stocks to Watch and markets 1/6/2015

Trucharts.com Stocks to Watch and markets 1/6/2015


Stock Charts Free, Stock Scans at TruCharts.com, Dividend stocks: Closed our ALTR short today and went short F (Ford Motor Co). Expect volatility to stay high and MU revenue forecast was lower than Street Expectations. Take profits in semi-sector now - Biotech breaking down - take profits. We are short GM,F and DAL. Long WSM, AMKR and LINE, CYBR, HMY. Check out our buy/sell signals on our stockview page - www.stockcharts.com/stockview.aspx.

Chart for MU: www.stockcharts.com/stockview.aspx?TICK=MU

December 21, 2014

TruCharts.com – Free Stock Charts – Blog week ending 12/19/2014

Trucharts.com Blog week ending 12/19/2014

For SEO: Trucharts.com – Stock Charts Free, Stock Market, Stocks, Charting, Dividend Stocks, World Markets, Technical Analysis, Market Sentiment Charts
Merry Xmas and happy holidays to all. We are in a short week of trading this week and the fireworks were on last week after Fed Speak. We did not expect any surprises from the Fed on the raising of the Fed Funds rate, and the Fed made it a point to tell the markets that it was still ok to take risks and that drove the markets to recover over a 800 points on the DOW and 100 points on the SP500. A lot of this was driven by energy stocks and since some of the stocks had dropped over 50% – there were short covering rallies and bottom fishing and a major short squeeze. BofA Merrill Lynch downgraded several semi stocks but these did not correct as much. The SP500 and DOW look like they are still in an uptrend and our indicators are still showing a trend for the markets to mover higher – after a short consolidation period. The move this past week was massive, but the volumes in some stocks was not high. 
We like XLU (www.trucharts.com/stockview.aspx?TICK=XLU) and the utility stocks as good dividend earners. Check out the charts for SO, ED, PCG and DUK. Even the REIT’s look good and some consumer staple stocks look good. We took a position in K or Kellog (www.trucharts.com/stockview.aspx?TICK=K) and USO – we believe this has finally bottomed for the short term. Keep an eye on CAT (www.trucharts.com/stockview.aspx?TICK=CAT) – we are looking to take a position in CAT. 
We have been hurt by our short position in IBB – but have been writing puts to improve our short price. Our other positions are doing OK – Long WSM, short YHOO (plan to close Monday), DAL, AEM. We are looking to go long CYBR.
There is definitely a XMAS rally going on and we expect this to last into the New Year – until the earnings season starts. AAPL (www.trucharts.com/stockview.aspx?TICK=AAPL) still looks good technically.
We added some new features to our site this week – execiting stuff:
1. MULTIPLE SYMBOL CHARTS on one page – check this feature out at: http://www.trucharts.com/multiplestockcharts.aspx
2. ICHIMOKU cloud indicator on our stockview page and turtle trade indicator
3. Added borders to our charts
Check the features out and also our page: http://truchartscom.blogspot.com/p/why-is-trucharts.html
In addition, we want everyone to take advantage of avoiding monthly recurring fees  and sign up NOW for one very low annual membership for full access for just $90/year – a 50% discount to the annual membership fees and this gives you real time categorized news and complete access to all of the site including dividend stocks etc.
Again – Best wishes for the holidays to all and a Happy New Year and good luck trading.

TruCharts Team

December 19, 2014

Trucharts.com pick updated

Trucharts.com TUBE pick updated:


Check our pick from 3 weeks ago - it is up to $22 - we picked it at 14.

Here is the chart with our buy/sell strategy:


We went long USO and K today for short term trades. We will close YHOO short next week. Our IBB short is hurting but we have been writing puts against this short to raise our short price. We expect markets to move higher into the New Year. DOW 18K and SP500 to 2100+ is going to happen. 

trucharts team 

December 16, 2014

Stock to watch - Markets update 12/16/2014

Stock Charts Free/Scans/Stock Screener at Trucharts.com:

We have been saying stay short or exit positions and take profits. We are still short IBB, YHOO and DAL. Long BIS, WSM. We expect gold to go down further. Russia may take drastic action because of the currency plunge.

Check out the charts for the following:

www.trucharts.com/stockview.aspx?TICK=REGN

www.trucharts.com/stockview.aspx?TICK=DAL

www.trucharts.com/stockview.aspx?TICK=BIIB

www.trucharts.com/stockview.aspx?TICK=IBB

www.trucharts.com/stockview.aspx?TICK=YHOO


December 15, 2014

Brief Update on Markets 12/15/2014


Free Stock Charts/Scans/Stock Screener at Trucharts.com - 


We talked about gold pulling back and being short IBB - both of these are moving down and the commodity complex breakdown is going to affect gold and gold miners. Russian ruble has completely crashed and is now worse than the Indian Rupee. Amazing what US political power can do. Short AEM, GM and IBB, long BIS and WSM.


Markets were up and everyone was getting excited this morning. Then we had a pullback and we need to wait and see if the markets consolidate here.

Trucharts team

December 14, 2014

Trucharts.com Blog week ending 12/12/2014

Trucharts.com Blog Week ending 12/12/2014


We expected the markets to hit 18000 for the DOW and 2100 for the S&P500. It came close but did not touch these milestones. We stated that the markets were looking extended and that the risk was high - that scenario played itself out this past week. The breakdown in oil and the commodity complex was not surprising. We expect oil to hit between 50 and 55 - that would be more than a 50% correction and we expect some bottoming in that range. The commodity 15 year bull cycle may be coming to an end. Stocks looked extremely extended and one of our sentiment charts was showing that a puulback was imminent. Check out this chart which had predicted prior pullbacks - it is the chart of the stocks below their 50d SMA vs S&P500 - check this chart below:


You can see in the chart above how the trend for the stocks above 50d SMA is trending down even when the market is hitting new highs. This is evident in both the charts for stocks on the NYSE and NASDAQ. It does not appear that this has bottomed. We should keep an eye on this indicator on ur reports page under "Charts" at .

We expect volatility to be up this week and the S&P to touch the 50D SMA at 2000 and we have to see if the buyers jump in. The DIA has it's 50D SMA at 172.4 - we would like to see if this bounces back. The megaphone pattern in the indices is lookign evident - but then we have to wait and watch - if that does play out then the S&P500 has to break below it's previous low on the prior corrction in October. 

Fortunately for our portfolio, we followed our charting buy/sell signal strategies and closed positions in SDRL (down over 50% from our sell price), RIG, USO (all oil related). We stated shorting GM - still looks like a good short - in addition we had shown the chart for FCX as short in our last blog. We are short ALTR, IBB, DAL, YHOO and long BIS, WSM. We have hedged our positions with puts and calls. Although we see opportunity oin shorting AA - we will wait and watch since we are over exposed to shorts currently. 

Good luck trading next week.

Trucharts team