Go Daddy Signup

Showing posts with label Stock Charts Help. Show all posts

May 27, 2015

Stock Market 5/28 - Midday Update Tuesday - Trucharts.com -

Midday Market update: 5/27


Stocks are bouncing back from the drop yesterday post Memorial day holiday from a possible buy the dip philosophy and possible Greece solution. 

We doubt this move/rally and would look to sell into rallies and take profits - NASDAQ is up from the biotech stock moves and some tech stocks. We like $DE, $BIDU and went long $TIF today. Stocks getting hammered are $WDAY, $KORS and $SHAK.  We like $MO and the tobacco stocks for their dividends and would look to go long. Short gold for now.

Markets look extended still and volatility is still low. Oil is dropping. Watch SVXY and VXX.

March 8, 2015

Trucharts.com - Markets, Hot Stocks, Blog week ending 3/6/2015

Trucharts.com Blog week ending 3/06 and Hot Stocks to Watch Week of 3/9
What a jobs report - wow!! - even our numbers were not close enough to the actual numbers. Our estimate for March jobs report was around 230K on the high side and the number came in at 295K and unemployment rate dropped to a respectable 5.5%. We do not expect any slowdown heading into the summer season - the US dollar rallied and gold got crushed - we stated that gold was heading down in our previous posts - and here comes the probability that the Fed will be pushed to raise the Fed funds rate by June - we expect even that if they raise it by 0.25bp - would still be too low to affect the markets. There will likely be a short-term pullback - we indicated in our posts on fb and g+ that the markets looked extended and a pullback to 2050 should be expected. Also Mar 9th will be the 6 year anniversary of the bull market. The markets will be on the watch out for Fed statements going forward and the strength of the US dollar maybe hurting the export driven companies, but is a good sign for the US and the US economy. There should be some concern around job losses related to the oil industry - which we would expect to see happen within the next few months. We heard on the news of layoffs from HP and Ebay. But job hiring scene is still strong in many sectors. Majority of the job growth was in the in the service industry in the March jobs report. With the Fed still staying the course with ZIRP - we expect that the markets will consolidate here with some pullback heading into the Q2 earnings season. Support for the S&P is in the 2050 area.
Check out the videos and articles we posted on our G+ and FB pages.
Market Stats (from finance.yahoo.com) Friday close:
DOW JONES IND: 17856.78 - DOWN -278.94; S&P500: 2071.26 - DOWN -29.78; NASDAQ: 4927.37 - DOWN -55.44
ADVANCERS/DECLINERS: NYSE: 308/1574; (RATIO ~ 1:3) - NASDAQ: 858/1944 (RATIO ~ 1:2)
UP VOL/DOWN VOL (Millions): NYSE: 673/3177 (~1:5); NASDAQ: 541/1308 (~1:3)
We have been short AEMIBB (has been hurting but is a hedged position), Long ANGITWTR, Z, USO, DATA, LLY.
All of pur positions have calls or puts written against the position(s).
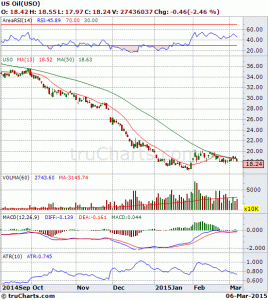
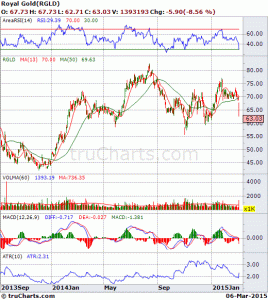
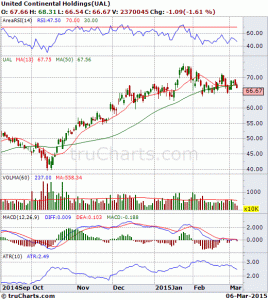
Here are stocks we are watching this week: Looking to short RGLD (or buy puts), Short UAL or buy puts and USO looks like it is pointing to lower oil prices - we have covered calls on USO. Here are the charts.
USO Stock ChartRGLD Stock ChartUAL Stock Chart


Check out the charts we posted in our blog last week.

Good luck trading - please check our page - Why Trucharts.com at: http://truchartscom.blogspot.com/p/why-is-trucharts.html.

Trucharts Team

March 1, 2015

Trucharts.com - Weekly blog week ending 2/27 - Hot Stocks to Watch

Trucharts.com Blog week ending 2/27/2015 - Markets and Hot Stocks, stocks and thoughts for the coming week

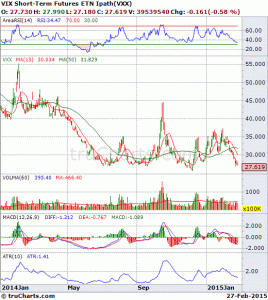
VIX dropping and the complacency is truly remarkable. Just check the chart here for VXX etf still heading down and we expect this to find a bottom and stabilize - the technicals are not pointing to any big move yet in volatility. We are heading into the sixth year of the bull market from the March 2009 bottom - earnings have been reasonable with some surprises and stocks which have beaten the estimates and raised forecasts have been rewarded their investors nicely. Check AVGO and CRM as examples. 
VXX chart:
VXX ETF Chart
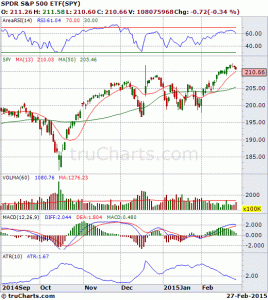
Oil dropped this week and gold stabilized around 1200 - we think gold will vacillate around 1175 - 1250 until there is an actual breakdown. We posted some good videos this week on the Fed's interest rate policy conundrum and how they have put themselves in a corner - and with the current ZIRP, we expect markets to trend higher after another consolidation phase here. A pull back to the 13 day SMA or even the 50d SMA would be a decent pullback. The leadership in stocks is narrowing and the breadth is narrowing also.  Here is the chart for SPY (check the technicals weakening RSI and MACD):

Target support is between 208 - 205 (around 2080 and 2050 for S&P500):
SPY chart
We expect oil to head down and try to form a bottom before heading higher into the summer season. Gas prices in California are still high due to some refinery shutdowns, labor strikes. We expect oil prices to stay between 40 - 55.
Greece which got its loan stay/extension - we just call it noise and the Euro is getting crushed. We are in an all out currency war now and we really like the US dollar here - as there is no other currency that is currently safe. This will impact gold prices as the USD heads higher.
Ukraine is in total disaster mode, Venezuela is sinking - Russia us struggling and China is slowing down. Japan is mired in debt and all it can think of doing is cheapen its currency.
Stocks that have triggered short signals are in the airline sector - check the chart here for DAL, UAL and LUV:
Also take a look at the chart for CAT here below:
Stocks on our list for longs are:
Additional stocks we are watching are: LLYALTR.
Our long positions with options are in the following stocks: LLY, USO, ANV, DATA, Z, TWTRANGI
As we indicated in our blog 2 weeks ago - our call on ALTR was excellent - we locked our profits based on the buy signal generated from our Fast Trading Signal Strategy. Profit was 4.5% and ALTR has hit 37 since our buy call around 34.7.
Check these trading strategies on our stock charts page at: www.trucharts.com/stockview.aspx 
Market Stats: (from finance.yahoo.com)

S&P 500: 2,104.50 -6.24 (-0.30%); Dow: 18,132.70 -81.72 (-0.45%); Nasdaq: 4963.53 -24.36 (-0.49%)

Advancers & Decliners


NYSE
AMEX
NASDAQ
Advancing Issues
1,614 (50%)
228 (57%)
1,034 (37%)
Declining Issues
1,530 (47%)
157 (39%)
1,676 (60%)
Unchanged Issues
93 (3%)
18 (4%)
91 (3%)
Total Issues
3,237
403
2,801
New Highs
99
6
105
New Lows
30
6
35
Up Volume
1,587,571,140 (45%)
87,795,645 (71%)
737,990,334 (39%)
Down Volume
1,903,862,936 (54%)
34,160,800 (28%)
1,151,918,788 (60%)
Unchanged Volume
60,957,743 (2%)
999,147 (1%)
24,153,883 (1%)
Total Volume
3,552,391,8191
122,955,5921
1,914,063,0051

Twitter handle: @trucharts; https://www.twitter.com/trucharts

Good luck trading - please check our page - Why Trucharts.com at: http://truchartscom.blogspot.com/p/why-is-trucharts.html

B Bhatia
Founder/CEO

January 25, 2015

Trucharts.com Hot Stocks and Stocks to watch - Weekly Blog update - week ending 1/23/2015

Trucharts.com Weekly Blog update - week ending 1/23/2015


A shortened week and the Draghi moment on Thursday when the markets were up nicely after another round of QE was announced 1 Trillion Euros – all central banks are printing money and there is no stopping – low interest rates (negative in the Eurozone) and then we have stock bubbles and ZIRP in US is showing up as bubbles in stock valuations and real estate. We do not expect the Fed to do anything this year on the Fed Funds rate and Draghi is bent on destroying the Euro (which incidentally is at 1.115 to the USD) – now European vacations are going to be lot cheaper. And then we had the Greek election and the drum roll please !!! – the anti austerity party won the elections – what a surprise!! Are the Greeks going back to the drachma??
Enough politics – what does this do to the markets – the move up on Thursday was a big move and the move down on Friday looked like a consolidation move and the trend is still intact – the RSI and MACD is moving higher and we think oil is vacillating within a tight range, and gold is also consolidating. Keep an eye on gold and oil. There are over 1300 companies reporting earnings this week. AAPL is on top of the list and as are many big names. Check out the earnings calendar on our site at:http://www.trucharts.com/earningsview.aspx and also we provide the earnings date for any stock on the stock charts page. Futures are pointing to a lower open, but we expect the AAPL earnings maybe the catalyst and Fed speak is what is going to drive the markets.
We are short GM, F, IBB, DAL (sold some puts also)  and long USO, WSM, K, CYBR, LINE and went long BOX on Friday. Our ALTR short was a good call and GM calls expired. Our Trucharts.com BUY/SELL strategies are working well and we are using these to make trade decisions along with watching the technicals closely. There will be a lot of noise during the earnings season, so be watchful. Here are some stocks we like: K, and the list below – futures are down this morning – so be careful with your entry and keep tight stops – the trend is still up and we think until the Fed speaks we may see some volatility.
BABA104.0200105.2000103.0200103.1100104.00009847987
CME88.500088.940087.680088.510088.57001058695
EBAY56.990057.280056.310056.760057.150013357022
ETFC23.900024.970023.780024.560022.650012271579
EXPE84.330088.650084.140087.440085.71003679708
HON101.1100103.9200100.5000102.410099.39005209857
HPQ39.960040.250039.760040.100040.06006171057
IWM118.3400118.7700117.5500118.1300118.200026223219
MNKD5.59005.80005.51005.74005.57004143225
NOW66.590069.500066.550068.740066.14001015475
SNPS43.200043.850042.900043.530043.1700448589
VLO48.150050.900047.740050.160048.000011559865
Check our Reports section for many other picks in the MACD bullish crossover reports and others.
Please spread the word and invite your friends to use the site and take advantage of out recommendations and site features.
Trucharts CEO and Founder
Bob Bhatia

January 15, 2015

Trucharts.com - Free stocks and Scans - Markets Update and comments - 01/15/2015


Another down day and we stated in our blog and during the weekly commentary the up move looked like a bull trap and that the markets looked precarious. Earnings are not coming in as expected - and the high expectations were reflected in the high valuations and stock prices - it was like there would be no end in sight - markets were moving up on low volume into the end of the year. 

Stocks that do not look good are BBY (Best buy), INTC (Intel), FB (Facebook) - we shorted FB today. We went long gold miners today and we stated that these were looking strong over the weekend - the gold move up was primarily due to the down move for the USD and then the SNB announcement that the Swiss Franc peg to the Euro was no longer in play - that drove gold even higher - this tells us that the Euro is doomed and it will go to par with the USD. A lot of hedge funds exploded today due to the short position in the Swiss franc. 

We showed several stocks on our blog that exhibited weak technicals and were flashing sell signals in our weekly commentary on g+ and twitter (@trucharts). We are short IBB, GM, F, DAL and AEM. Long ANV, WSM, USO, LINE, K and BIS.

Click here to access the charts on our site: www.trucharts.com/stockview.aspx

The markets for the short term have not bottomed yet and we should see some technical weakness into the earnings barrage next week. We would short BBY here and our next pick is LAD - we think the auto cycle has peaked and any stock dealing with the auto market is a short - especially dealers and manufacturers (GM, F are examples of stocks we are short). Here is the chart for LAD and it flashed a red sell signal yesterday:

Use our site for auto buy and sell signal strategy. You can save and make money using this excellent proprietary trading indicator.