Go Daddy Signup

Showing posts with label Stock blog. Show all posts

March 22, 2015

Where are the markets headed this week and hot stocks to watch - Trucharts.com Blog

Trucharts.com Blog week ending 3/20/2015

Where are the markets headed this coming week and what are the hot stocks to watch this week.

The Fed spoke and the markets rocketed higher last week and gold moved higher and stocks responded positively to the Fed comments - bonds moved higher and yields dropped, the dollar was crushed for a short time and then bounced back. We still like the US dollar and we expect the Euro to head lower. The Fed is cornered and scared to do anything to upset the markets - and they are into playing 'WORD' games - patient and impatient etc. It is truly absurd how the markets are so hung up on words from the Fed. The markets were driven down heading into the Fed meeting and then the VIX got crushed and all the market indices rocketed higher right after the Fed meeting. Basically the Fed said they will not raise rates in June - something that was not surprising to us - we do not expect the Fed to raise rates at all this year even though there is lot of jawboning going on by the Fed and it's governors.

The DOW JONES INDUSTRIALS climbed above the 18K number - NASDAQ buoyed by the flaming biotech stocks and semiconductor stocks breached the 5000 mark and has everyone now waiting and talking about breaking the 2000 high - which we expect is coming to get all the news talking heads excited and bubbling with joy.

Biotech stocks the darlings of Wall Street are having price movements like the internet stocks of 2000 - we do not know when or how this is going to end - companies are buying other smaller rivals or companies with potential blockbuster drugs - and this can last as long as we are in this Fed driven rally and a zero interest rate environment - which says keep taking risks until We (the FED) says time out.

Technically speaking even though the RSI and MACD are exhibiting lower highs with this move up - the patterns seems to indicate higher highs. The NASDAQ is technically broken out to a new high. There maybe some pullbacks (consolidation) - but the trend is for higher highs. We are heading into earnings reporting season and need to be on guard for any potential earnings warnings - please keep these in mind prior to taking any big positions or longer term bullish positions.

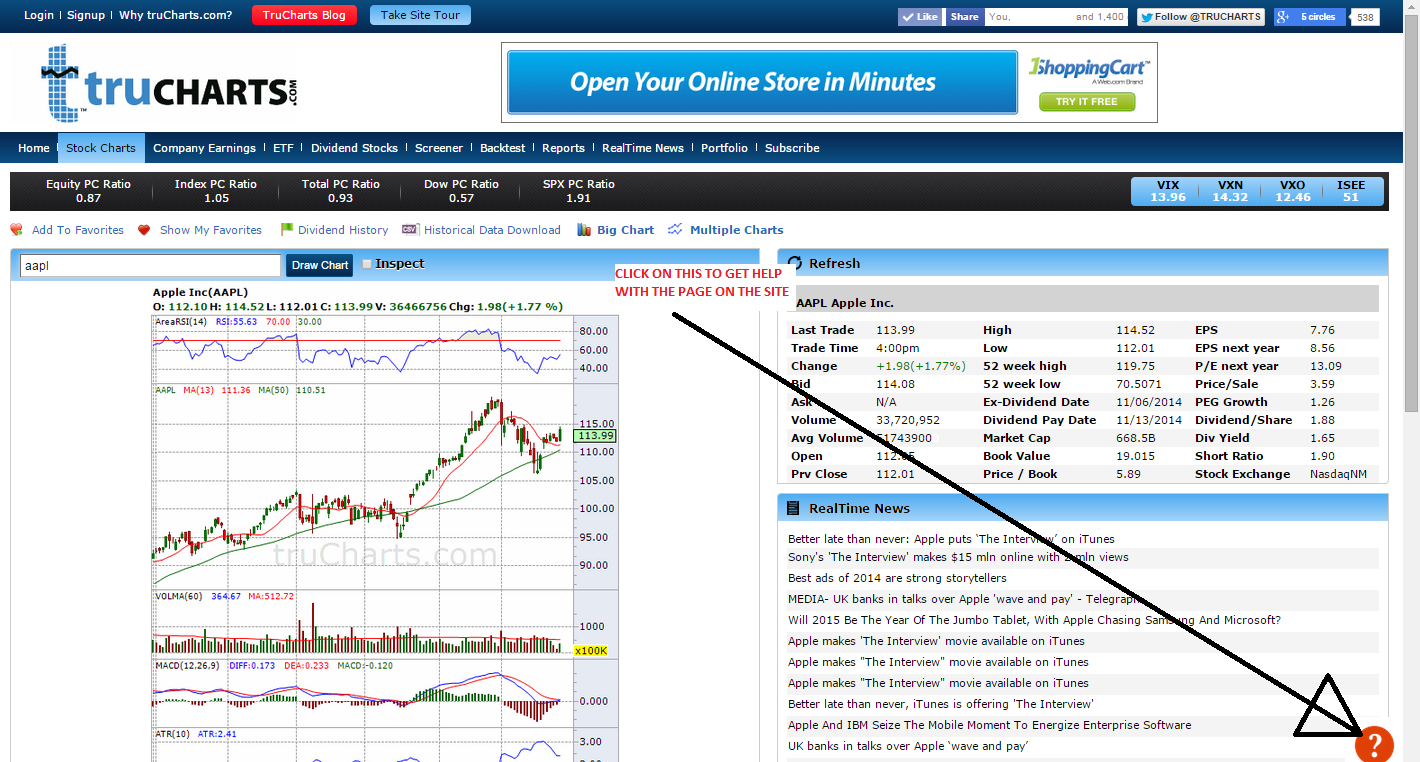
AAPL was integrated into the DOW Industrials this week and is a Dow component now. We would be watchful of AAPL here. SBUX announced a stock split this week and SWKS, NXPI and AVGO hit brand new all time highs. Check out our reports page at www.trucharts.com/marketreports.aspx for stock lists with technical breakouts etc.

The biotech sector is on fire and we were wrong on our call in this sector but still believe that this sector is definitely overextended - but right now the sector is still in the hands of the bulls - just check stocks like www.trucharts.com/stockview.asp?TICK=REGN - please check the stock from period 2000 to now and you will see what we mean by exponential moves.

Stocks we picked last week - LLY and SO, PCG did well during this week and LLY was up over $6 from our pick price. 

Stocks we like this week - TWTR, MYL and TEVA - we will be watching these closely and be looking to go long TWTR. Here are the weekly charts (TEVA is breaking out):


Good luck trading.

Trucharts.com team and Founder 

March 11, 2015

Stocks of Interest - and Covered Call Strategy with 12% return - Market closing 3/11/2015

Trucharts.com - Markets Update and Stocks of Interest and Covered Call Strategy for BIDU

Markets were in an oscillation mode today and we had several negative and positive readings. But at the end of the day - markets ended down. We shorted UAL today - even though it was up today - our position in BOX stock is doing well (we write covered calls and / or covered puts on our longs/shorts) as needed based on market conditions.

We still expect SP to test 2025 and the Euro to go below par to the USD - our target is 0.90 - 0.95 - currently it is at 1.056 approximately.

We are short AEM and UAL. Stocks long positions are BOX, TWTR, USO, DATA, Z. 

Looking to go long BIDU - chart here - www.trucharts.com/stockview.aspx?TICK=BIDU - we like the stock primarily because it looks oversold and the call premium is very good and therefore the short term returns with covered call writing will provide a good return on the investment. Be aware that this a volatile stock. 

So let us say you buy 100 shares on margin - for 2 months - margin rates vary but are around 2-4% currently.

The covered call for near the strike price of 205 for APRIL 17 2015 is around $5.00 - so you will collect 500 as premium for one month and then your cost will be around 200. Let us say on April 17th the stock is at 200 and your call expired worthless (205 strike) - you can write the 200 call for May 15th around that time should be around $7 and you collect 700. Your total investment on margin at 50% is $10000 and you collected $1200 as premium on the calls and your cost went down to around $193.  BIDU call writing makes lot of sense and therefore we are looking to do this trade.

TruCharts team   

March 1, 2015

Trucharts.com - Weekly blog week ending 2/27 - Hot Stocks to Watch

Trucharts.com Blog week ending 2/27/2015 - Markets and Hot Stocks, stocks and thoughts for the coming week

VIX dropping and the complacency is truly remarkable. Just check the chart here for VXX etf still heading down and we expect this to find a bottom and stabilize - the technicals are not pointing to any big move yet in volatility. We are heading into the sixth year of the bull market from the March 2009 bottom - earnings have been reasonable with some surprises and stocks which have beaten the estimates and raised forecasts have been rewarded their investors nicely. Check AVGO and CRM as examples. 
VXX chart:
VXX ETF Chart
Oil dropped this week and gold stabilized around 1200 - we think gold will vacillate around 1175 - 1250 until there is an actual breakdown. We posted some good videos this week on the Fed's interest rate policy conundrum and how they have put themselves in a corner - and with the current ZIRP, we expect markets to trend higher after another consolidation phase here. A pull back to the 13 day SMA or even the 50d SMA would be a decent pullback. The leadership in stocks is narrowing and the breadth is narrowing also.  Here is the chart for SPY (check the technicals weakening RSI and MACD):

Target support is between 208 - 205 (around 2080 and 2050 for S&P500):
SPY chart
We expect oil to head down and try to form a bottom before heading higher into the summer season. Gas prices in California are still high due to some refinery shutdowns, labor strikes. We expect oil prices to stay between 40 - 55.
Greece which got its loan stay/extension - we just call it noise and the Euro is getting crushed. We are in an all out currency war now and we really like the US dollar here - as there is no other currency that is currently safe. This will impact gold prices as the USD heads higher.
Ukraine is in total disaster mode, Venezuela is sinking - Russia us struggling and China is slowing down. Japan is mired in debt and all it can think of doing is cheapen its currency.
Stocks that have triggered short signals are in the airline sector - check the chart here for DAL, UAL and LUV:
Also take a look at the chart for CAT here below:
Stocks on our list for longs are:
Additional stocks we are watching are: LLYALTR.
Our long positions with options are in the following stocks: LLY, USO, ANV, DATA, Z, TWTRANGI
As we indicated in our blog 2 weeks ago - our call on ALTR was excellent - we locked our profits based on the buy signal generated from our Fast Trading Signal Strategy. Profit was 4.5% and ALTR has hit 37 since our buy call around 34.7.
Check these trading strategies on our stock charts page at: www.trucharts.com/stockview.aspx 
Market Stats: (from finance.yahoo.com)

S&P 500: 2,104.50 -6.24 (-0.30%); Dow: 18,132.70 -81.72 (-0.45%); Nasdaq: 4963.53 -24.36 (-0.49%)

Advancers & Decliners


NYSE
AMEX
NASDAQ
Advancing Issues
1,614 (50%)
228 (57%)
1,034 (37%)
Declining Issues
1,530 (47%)
157 (39%)
1,676 (60%)
Unchanged Issues
93 (3%)
18 (4%)
91 (3%)
Total Issues
3,237
403
2,801
New Highs
99
6
105
New Lows
30
6
35
Up Volume
1,587,571,140 (45%)
87,795,645 (71%)
737,990,334 (39%)
Down Volume
1,903,862,936 (54%)
34,160,800 (28%)
1,151,918,788 (60%)
Unchanged Volume
60,957,743 (2%)
999,147 (1%)
24,153,883 (1%)
Total Volume
3,552,391,8191
122,955,5921
1,914,063,0051

Twitter handle: @trucharts; https://www.twitter.com/trucharts

Good luck trading - please check our page - Why Trucharts.com at: http://truchartscom.blogspot.com/p/why-is-trucharts.html

B Bhatia
Founder/CEO

February 22, 2015

Trucharts.com - Hot stocks to watch and - Blog week ending 2/20/2015

Trucharts.com Blog week ending 2/20/2015 - And Stocks to Watch for the coming week and markets

Well another week and another set of new highs for all the indices - S&P, Dow and NASDAQ (headed to 5000) - We have been saying that what we experienced the week before was a breakout of descending triangle pattern and the markets just moved higher after the breakout. The Eurozone Greek situation is just noise and it is totally irrelevant to the markets in the US. That has been our theme and it has made money for us. Although we are seeing fewer stocks participating in this move up - nevertheless, the markets are heading higher. We expect a pullback to the 13d SMA and we should be mindful of that. We still like certain stocks and we will discuss these below. The Russian issue with Ukraine - just more noise - and Putin is going to keep the West on its toes - while the West is going to keep putting pressure on Russia by driving the price of oil lower - we expect this to be a bottoming process for oil and should last through summer this year. Gold is pulling back as the market moves higher and we are short AEM (www.trucharts.com/stockview.aspx?TICK=AEM) We are long USO and will keep writing covered calls on the USO position.

Our picks from our blog last week did very weel - TWTR, CYBR, USO, LINE - we closed LINE and CYBR this week.
Markets on Friday moved up due to the loan extension granted to Greece for 4 months - and the markets just rocketed higher - even with narrowing breadth/leadership. NASDAQ is being driven by the biotech sector and this weekend SLXP is being bought by Valeant for ~10B.

Next week we expect the Fed to keep the patient theme in their language to the Congress and here is a good article on earnings and news for what will drive the markets next week:

Here are the market stats from Friday close(check the New Highs and New Lows on the NYSE and NASDAQ - lopsided to the New Highs) - means the markets are still seeing a fair number of new highs relative to new lows with market at all time highs - still a bullish sign:

Advances & Declines
NYSE
AMEX
NASDAQ
Advancing Issues
2,143 (66%)
206 (51%)
1,427 (51%)
Declining Issues
1,005 (31%)
170 (42%)
1,263 (45%)
Unchanged Issues
90 (3%)
26 (6%)
106 (4%)
Total Issues
3,238
402
2,796
New Highs
164
9
131
New Lows
14
7
31
Up Volume
2,197,896,660 (67%)
58,220,649 (51%)
1,081,999,545 (63%)
Down Volume
1,044,822,426 (32%)
54,108,506 (47%)
594,106,069 (35%)
Unchanged Volume
53,196,027 (2%)
2,284,090 (2%)
32,536,265 (2%)
Total Volume
3,295,915,1131
114,613,2451
1,708,641,8791

Here are the stocks we will be watching this week and we especially like: KLAC, ALTR, Z, ANGI - check out the weekly charts for Z, ANGI and ALTR here below:

(Check the volume for ANGI) - we want to clearly warn you that these are risky stocks - the charts are for information purposes only. We will be looking to buy these based on our analysis.

Zillow stock chart


ANGI Stock Chart


Here are some other charts of interest this week:

www.trucharts.com/stockview.aspx?TICK=ALTR (we closed this week for 4.5% profit)

We closed out GM and F short spread for a small loss - we could have stayed short but decided to close these.

Check out our special subscription rates for new subscribers at:  http://www.trucharts.com/truCharts_Services.aspx

For SEO: Charts, Charting, Free Stock Charts, Free trading, Stock Screener, Dividend Stocks, Hot Stocks, MACD, Candlestick patterns.

Best of luck Trading.

Trucharts.com Founder/CEO

February 9, 2015

Delayed Blog posting due to travel and restrictions

To all:

Due to my personal travels for the past two weeks and travel to China - my blog has not been updated due to bloggin restrictions in China - we will be posting a big update later today - just a brief update on our calls on oil and the ETFs for oil (USO and OIL) these have moved up sharply from our recommendations and as has TWTR which really worked very well for us. We have been long USO and LINE which have moved up over 10% and 30% in the past week and TWTR has moved over 20%. We will discuss these and many other things during our blog update later today.  Good luck trading and watch BOX stock.

Trucharts Founder/CEO

December 28, 2014

Trucharts.com - Stocks to watch and Marlets blog week ending 12/26/2014

Trucharts.com Markets Update Blog week ending 12/26/2014:

Well now we have the New Year week coming up and markets keep making record new highs. This is the highest number of new record highs hit in one year. DOW and S&P500 are still trending higher. Keep an eye on the 13 and 15 week moving averages for the stock indices and the stocks - these are very critical - you can check these on our site when you click on the week option for period on the stockview.aspx page (www.trucharts.com/stockview.aspx). There was record amount of money put into stock ETFs this past week - check this article - http://finance.yahoo.com/news/u-based-stock-funds-attract-001225961.html; There are technical indicators that look weak - like lower RSI and lower MACD on higher highs - but these are not necessarily pointing to any pullback at the present time. We are still in a seasonally strong period for equities and heading into a New Year - we do not see anything other than some minor pullbacks as we head into the earnings season. Oil seems to be trying to find a bottom here; gold bounced on Friday - we will keep an eye on this - specially due to the turmoil in the currency market in Eastern Europe (including Russia). 

We are long USO, AMKR and short AEM. Our target for gold is still 1000. There are several stocks that look strong - here are th symbols and charts -AAPL and more. We are looking to go long AAPL this week. The rules are very simple - DO NOT FIGHT THE FED and STAY WITH THE TREND. Now the Yellen put is in place and everyone does not epect any major change in the Fed' stance this comng year (till at least middle of 2015) - companies revenues are not growing based on the P/E multiples - yet these stocks keep moving higher - the average PE is being stated as low and this is happening based on significant stock buy backs being used by companies to boost their earnings and EPS. But none of these matter, since the belief is that stocks will just keep moving higher. We will stay with the trend until it breaks - (Ms Yellen (Ms Clause) will come save the day).

Here are some other symbols to watch this coming week:

For full disclosure - we are long AMKR, WSM, BIS, CYBR, K and short ALTR, DAL, YHOO, AEM (will close YHOO this week).

We added a special new feature on our site - check it out at: http://www.trucharts.com/multiplestockcharts.aspx (mulitple charts on one page)

Some good reading material: (ADDED ANOTHER GOOD ARTICLE)

Here is the picture of how to use and access help on our website with any page.
Trucharts help


Check out our special subscription offer - no more monthly recurring fees - just $90 for the full year (50% discount)- here is the link: http://www.trucharts.com/truCharts_Services.aspx

Happy New Year to all - and good luck with trading in the New Year.

Trucharts Team

December 12, 2014

Trucharts.com - Markets Update and stocks to Watch 12/12

Free Stock Charts/Scans/Stock Screener at Trucharts.com:

Markets down today - check out our published chart for SPY - we stated trend was down and we are seeing that manifested in the markets today. Yesterday was a short squeeze and today we are headed to 2000 on the S&P.

Stocks to watch: ADBE, RH - for coming week.  Short DAL, YHOO, AEM and IBB.

This is what our elected officials are doing in the United States of America - watch out for your future and we elected these folks to represent the common man - unbelievable..


December 10, 2014

Markets Update 12/10/2014

Markets Update 12/10:

Markets down, oil down, gold down and our short positions are right on the money. We have been saying markets look extended here and the commodity crash will impact the markets. We have been short DAL, YHOO, ALTR, AEM and long BIS, WSM, CYBR. We think the markets will test the 50d moving average. GM still looks like a good short.


Watch this closely - HYG - correlates to market performance and trend.

December 7, 2014

Trucharts.com Blog and stocks to watch - Week ending 12/5/2014

Trucharts.com - Blog update and Stocks to watch:

Another week and another set of new records and new highs. There is no stopping this train. Excellent jobs report (321K new jobs created). Oil dropped this week and so did the commodities. Energy stocks are getting slammed and so are commodity stocks. We think there maybe an end coming to the commodity cycle - many have indicated that this is typically a 15 year cycle that started in 2000 and will end by 2015. This will impact commodity stocks - so if you have commodity stocks in your portfolio - like FCX, BHP, RIO - be mindful and this end to the commodity cycle may impact the dividends being paid out by the commodity stocks. Another concern recently has been the drop in the oil sector stocks and their issuance of junk bonds to fund their exploration - the main concern is related to the capability of these companies to pay back this debt due to the drop in oil prices (check JNK). Financial stocks are breaking out. We are watching BAC (Bank of America) - here is the chart (weekly) - looks like it is going to breakout (Other stocks to watch in this sector - financial - JPM, XLF, MS, ETFC, AMTD)
Stock Chart BAC


Gold is still holding between 1100 - 1200 - watching this closely - we still think this is headed to 1000.
Health stocks and airline stocks were hitting new highs this week along with many tech stocks. AVGOMCHP, SYNA and SLAB announced better outlooks for the coming quarter. We like the chart of SLAB - here is the chart (check the MACD and RSI):
Stock Chart SLAB


Right now the trend is your friend and the don't fight the Fed. We will look to go long the financial stocks this week. Keep and eye on the commodity stocks.
We are still heading into the holidays and a strong period of the year for the markets - we would expect some consolidation - but DOW 18K is imminent and as is SP500 hitting 2100. We are short AEM, IBB (hurting right now), YHOO (will likely close this tomorrow and go long BAC). Watching the stocks above and UTX.
Good luck trading.
Trucharts team