Go Daddy Signup

Showing posts with label F. Show all posts

March 4, 2015

Markets and AA short

Trucharts.com - Stock Charts Free, Free Scans and Buy/Sell signals:


Be watchful here - markets are exhibiting characteristics of topping out after the NASDAQ run to 5000. Leadership is very thin and breadth is going down. We would take some profits and some money of the table.

Shorting AA after car sales report yesterday and breakdown in AA chart technically - here is the chart:


A very good article on oil and how it is going to impact companies in the oil sector: read it:

February 22, 2015

Trucharts.com - Hot stocks to watch and - Blog week ending 2/20/2015

Trucharts.com Blog week ending 2/20/2015 - And Stocks to Watch for the coming week and markets

Well another week and another set of new highs for all the indices - S&P, Dow and NASDAQ (headed to 5000) - We have been saying that what we experienced the week before was a breakout of descending triangle pattern and the markets just moved higher after the breakout. The Eurozone Greek situation is just noise and it is totally irrelevant to the markets in the US. That has been our theme and it has made money for us. Although we are seeing fewer stocks participating in this move up - nevertheless, the markets are heading higher. We expect a pullback to the 13d SMA and we should be mindful of that. We still like certain stocks and we will discuss these below. The Russian issue with Ukraine - just more noise - and Putin is going to keep the West on its toes - while the West is going to keep putting pressure on Russia by driving the price of oil lower - we expect this to be a bottoming process for oil and should last through summer this year. Gold is pulling back as the market moves higher and we are short AEM (www.trucharts.com/stockview.aspx?TICK=AEM) We are long USO and will keep writing covered calls on the USO position.

Our picks from our blog last week did very weel - TWTR, CYBR, USO, LINE - we closed LINE and CYBR this week.
Markets on Friday moved up due to the loan extension granted to Greece for 4 months - and the markets just rocketed higher - even with narrowing breadth/leadership. NASDAQ is being driven by the biotech sector and this weekend SLXP is being bought by Valeant for ~10B.

Next week we expect the Fed to keep the patient theme in their language to the Congress and here is a good article on earnings and news for what will drive the markets next week:

Here are the market stats from Friday close(check the New Highs and New Lows on the NYSE and NASDAQ - lopsided to the New Highs) - means the markets are still seeing a fair number of new highs relative to new lows with market at all time highs - still a bullish sign:

Advances & Declines
NYSE
AMEX
NASDAQ
Advancing Issues
2,143 (66%)
206 (51%)
1,427 (51%)
Declining Issues
1,005 (31%)
170 (42%)
1,263 (45%)
Unchanged Issues
90 (3%)
26 (6%)
106 (4%)
Total Issues
3,238
402
2,796
New Highs
164
9
131
New Lows
14
7
31
Up Volume
2,197,896,660 (67%)
58,220,649 (51%)
1,081,999,545 (63%)
Down Volume
1,044,822,426 (32%)
54,108,506 (47%)
594,106,069 (35%)
Unchanged Volume
53,196,027 (2%)
2,284,090 (2%)
32,536,265 (2%)
Total Volume
3,295,915,1131
114,613,2451
1,708,641,8791

Here are the stocks we will be watching this week and we especially like: KLAC, ALTR, Z, ANGI - check out the weekly charts for Z, ANGI and ALTR here below:

(Check the volume for ANGI) - we want to clearly warn you that these are risky stocks - the charts are for information purposes only. We will be looking to buy these based on our analysis.

Zillow stock chart


ANGI Stock Chart


Here are some other charts of interest this week:

www.trucharts.com/stockview.aspx?TICK=ALTR (we closed this week for 4.5% profit)

We closed out GM and F short spread for a small loss - we could have stayed short but decided to close these.

Check out our special subscription rates for new subscribers at:  http://www.trucharts.com/truCharts_Services.aspx

For SEO: Charts, Charting, Free Stock Charts, Free trading, Stock Screener, Dividend Stocks, Hot Stocks, MACD, Candlestick patterns.

Best of luck Trading.

Trucharts.com Founder/CEO

January 19, 2015

Trucharts Blog Stock Charts Free - Week ending - 1/16/2015

Trucharts.com Blog week ending 1/16/2015. 


Happy MLK day - markets were closed today - but what a closing on Friday almost 8:2 advancers vs decliners on NYSE and NASDAQ - we suspect short covering rally and short term oversold conditions - but technically the markets look weak and we had a 13d SMA crossing the 50dSMA for the indices - we expect a bounce to the 50d SMA - we had a strong close and gold moving higher, along with oil. And then we had the Dutch cut their interest rates to -ve. SO we pay the banks money to hold cash - think about that for a second - you pay the bank to hold your money - wow!! Then there is the expectation that the ECB will unleash another round of QE - when are the idiots in the Eurozone get it through their thick skulls - QE does nothing in a heavily taxed and socialistic government structure - reduce taxes and act like Ronald Reagan and let's see what happens - really dumb people lining their pockets. So stupid.

Today China reported the GDP number - 7.4% and then yesterday the markets in China got crushed as China pricked the stock bubble by regulating margin accounts which were non-compliant to the capital requirements. Now everyone expects China to unleash another round of stimulus. The whole world and asset prices are now running on steroids - that is what I call QE and all these stimulus injections into the economy - eventually these will hurt and the central banks are scared shit. Gold is the real currency and there is now a currency war in play an oil glut and stocks/real estate in bubbles everywhere. We never seem to learn from our mistakes.

This will be the start of the earnings barrage week - check the earnings calendar on our site at: http://www.trucharts.com/EarningsView.aspx

We closed our ALTR calls last week - our call on ALTR short was correct.
DAL - we sold puts for Jan 30 for 44 strike - we are still short DA and the 44 puts, GM and F.
Our GM call spread for 34.5 and 36.5 expired worthless. Our stock K is doing well and we are long WSM, TWTR, CYBR, USO and ANV. We still like gold here because it broke through resistance and the Chinese New Year is in February.

Here are some good picks for the coming week -
XLU (www.trucharts.com/stockview.aspx?TICK=XLU); Other stocks (www.trucharts.com/stockview.aspx?TICK=SO) - the utility stocks look good in this falling interest rate environment. Our call on HELE was good - still looks strong.

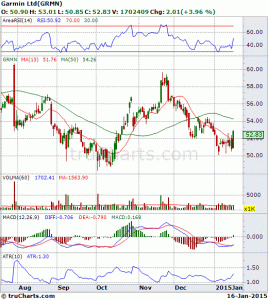
Chart of GRMN here below - looks good technically for a short term trade:


GRMN stock chart

November 17, 2014

Trucharts.com F stock Update BUY/SELL Strategy

Here is an update on F (Ford) stock - based on our BUY/SELL strategy - stock is up 1.5 from our buy signal in less than one week. Sign up for our subscription service and get access to this feature;


November 14, 2014

Stockcharts - F (Ford) Trucharts.com Buy/Sell strategy

Check out this chart below with our buy/sell strategy for F (Ford and Co) - this is a fast trading strategy so in congestion areas you will get more signals - but you want wait for break out and you will see F moved from 14 to 15.2 today and then also observe the Sell In Sept.

Almost 8% return within less than a week.