Go Daddy Signup

Showing posts with label Stocks to watch. Show all posts

May 6, 2020

Markets with no fear and on a tear...

Markets with no fear and on a tear...

Markets have been on a tear after the huge drop in Q1 March when we dropped around 12K points on the DJIA and have recovered over half of these points already.. But that is not the main story here - the DJIA, a closely monitored daily index is not reflective of what is happening in other bubble areas of the NASDAQ and software companies which are trading at multiples unheard of even in the dot com bubble days... And no matter what anyone says - or the talking heads on Bloomberg or CNBC - these prices for the stocks are driven entirely by nothing else other than Fed policies and actions. There call to basically monetize anything and drive rates to ZERO during this pandemic - along with now going as far as loaning money to businesses is beyond belief.. The Fed has clearly crossed its mandates without any regard for the future of this nation or the debt that is entailed on our future generations. We utter or throw words of TRILLIONS as if it is a joke - now the US is indebted and the Fed's balance sheet is now growing like a weed..with no Roundup.. Over $6T and heading higher - we wish we had a money printing machine to print unlimited money in our backyard with no repercussions or consequences for our actions - at least that is what these bozos at the Fed and in the government think.. It is just keep printing and there is no way in hell we will ever pay back this debt - EVER!!!

Machine trading has taken over markets - stocks are moving over 100% in a span of less than a month and not one talking head or the Fed comes and says - yup this is a bubble... Totally out of it - they will all be out of their positions at the Fed when the bills come due and earning millions at private banks/institutions and will be called saviors.. No wonder sometimes we agree with Trump - that there is really fake news and propaganda out there to keep this bubble growing - companies with ZERO revenue growth and revenues trending down and folks come on TV and analysts screaming new targets and buy recommendations - unheard of in the last 30 years.. There is ZERO sense of price discovery any more and no regard for revenue, PEs, P/S ratios, margin and name it - no metric matters.. It is just trading and some justification is provided for why the stock price is where it is.. Just take a look at AMD, NVDA, SHOP, COUP, TTD, CRWD, ZS, ZM, OKTA, DXCM and many more - trading at numbers we would consider not just in the stratosphere but beyond... But what does this mean - as long as the Fed rates are ZERO and policy is accommodative you have to trade this market and make money. Trading intraday or overnight and using options has been a really profitable way to make money.. And with the volatility in stocks as high as it is now - there is no way you cannot make money.. Machines are trading and the where the machines are buying and the market actions and stock intraday volumes are very reflective as to how the action during the day is going to be.. The list above is very useful for making money and monitor these stocks and you will see what we are saying - SHOP has moved over 100% in less than a span of a month.. Think about it - people are giving money to the US government for 10 years at 0.3% and this stock moves 100% in less than a month... Yup it is not a bubble...!! The Fed is asleep and is actually just acting as ignorance is bliss or are fully aware but refuse to bring reality and real price discovery back to markets...We are truly in a different era and market model and what I call the Twilight Zone markets.. 

Here are some charts for your perusal - just huge moves and if you were smart you would have bought as the VIX was in BUY territory... just take a look at the bounces of the recent correction - staying long as we expect DOW and SPY to hit brand new highs next year - 40K for the DOW and 400 for SPY.. 

Also check out our buy/sell signals in charts below and on our stockcharts page along with our screeners - truly awesome.. 

We will be adding unlimited trading for $30 on our site soon - so for all you options traders (stock trading is ZERO commission) and unlimited options trading will be $30.. No one offers that except us in partnership with Tradier brokerage - options commissions on per contract basis are half of all the other brokerages.. $0.35 per contract vs $0.65 for all others.. The $30 unlimited trading has no limit or minimums..


and many more on our site at www.trucharts.com/stockcharts.aspx.

make money while the sun shines.. long any tech stock.. Wait on leisure stocks for now till August..

Bob B.
Founder - Trucharts.com

June 7, 2017

S&P and all indices at records - Wow Trump did have a huge impact on markets. Where do we go from here?


Welcome to the era of Trump and record high markets:

First of all, I wanted to apologize from being away so long from writing my blogs. Due to personal medical reasons, I was unable to keep my blog updated.

Well, we are definitely in the record books for sure. All indices at all time highs, financials were up, airlines up - everything is and has been going up. Financials did pull back from their highs after the Trump agenda does not seem to be materializing. But tech stocks - unbelievable run - all semi stocks, NVDA, AMD and many others are trading like it is 1999. Many amateurs are jumping into the market and let me tell you, I lived through 1999-2000, cashed out at the top - and this is looking like deja vu all over again - maybe to slightly smaller extent. Stocks are trading at sky high valuations and nobody cares, the media just keeps priming the pump and the bubble - along with the Fed.

It has been a nice run and we are still not seeing any real technical weakness - except in the financial stocks. AMZN, GOOG, FB, NFLX (or FANG stocks) along with TSLA are trading at valuations that are the GDPs of many nations combined together. I think it is getting crazy - but make hay while the sun shines. There is no regard for risk or risk aversion and therefore one as an investor or trader needs to make sure they have their stops in place. This is a good time to have one foot out the door. 

There is no question that this is a liquidity driven bubble, the Fed and all central banks are driving this bubble with no regard for the debt and market valuations. You can tell you are in a bubble when the markets and certain stocks bounce back to new highs even on bad news - mind you there has really been no real growth in revenue - there has been financial shenanigans and financial engineering to create wonderful rosy outcomes. Huge stock buybacks, and setting expectations low with the analysts community - and then during earnings season beating the estimates - sounds like a nice scam to me. But the SEC is powerless entity and they just play along. 

Anyway, we think there is still room at the top. With all this talk (no action) about tax reform, health care reform, infrastructure - well Mr. Trump does not seem to get that this is not like erecting a skyscraper - or just making a golf resort - this is the government and the government does not run like a business - and you cannot run it like a reality show - he just loves showmanship. Anyway, back to the markets.

So we like the following stocks - AAPL, WDC, PANW, INTC, QCOM - there are many others, but we are being opportunistic in our trades and watch for new highs and breakouts. We also look at the technical end of day reports from our site at www.trucharts.com/marketreports.aspx - look for RSI less than 30, improving RSI, TC Positional Buy signals and MACD crossover reports. 

The unemployment picture is not looking good - debt at consumer level is at record highs and this is already impacting the retail sector - obvious from the store closing and stock prices. Leadership is narrow and housing is looking like a major bubble - rides along with stock prices. 

We are in a bull market and heading higher into the IPHONE 8 season and going long AAPL is a good trade. Keep good stops and wait for our next update soon.


Good luck trading.

Trucharts.com
Founder


September 25, 2015

IBB short update?? Read it..


We are providing an update on our position on IBB. It is slated to close below 50d SMA for the 1st time in over 18 months. We would short it here - we are short since 340. See RSI and MACD - trending down - this is weekly chart.

Here is the chart:


July 9, 2015

Greece, Markets and Dow Jones below 200d SMA - Mid week update - Blog Trucharts.com Stock Blog

Mid Week Update - Trucharts.com Stock Blog - Will Grexit be a reality and stocks to trade and China stock markets

SEO stuff: 

Stock Charts Free - Trucharts.com - Technical Analysis, MACD, ETFs, Dividend stocks, Charting, Free Charts, Stock trading, Hot stocks, Trading Strategies:

What a week - sorry, we could not post over the weekend and then we had huge market movements in China, US and then the Greek referendum. 

China markets were down over 30% and the Chinese government made or passed laws to arrest folks who were aggressively short selling, then increased margin leverage, forced brokers to plead a measly 120B Yuan to buy stocks, banned companies from selling their own stock and I am not sure when this list will end. Well in response to all these wonderful government interventions, the markets rebounded yesterday to the tune of 200 points and everyone was getting excited. We are non-believers of this rally and think it will still take its own course eventually - we believe the China growth engine is slowing due to their shadow banking and debt problems of the state owned entities. We expect the Chinese GDP growth to drop to below the 7% number and the Chinese are very concerned. We stated that the world is mired in overcapacity and China is at the root of this overcapacity. We expect a slight bounce in the markets here, but the downtrend should resume - timing not clear. When you are minting a billionaire everyday, you will eventually have more billionaires than anywhere in the world... Bubbles, bubbles and more bubbles and the Chinese government does not know how to handle bubbles - amateurs. And they have been printing money non stop - this will come to haunt them someday.

Now Greece - well the referendum passed with an overwhelming NO to the Eurozone and it is not clear what the Grexit will look like - we believe the Eurozone members Germany and France are extremely concerned about the future of the Euro zone if they allow Greect to exit - this is called dismembering - if one falls will others follow - Italy, Spain, Portugal and who else!! That is the reason the Eurozone leaders are scrambling to prevent Greece from exiting - we still expect that this is inevitable.. 

US markets - We stated in our previous blogs that the markets were exhibiting topping action and sure enough we had the markets trying to hold levels of 18000 for the DOW, 2100 for the SP500 and the 5000 level for NASDAQ. This topping action was ongoing for 4-6 weeks with 3 digit moves every other day. Eventually the markets broke down and now the earnings season is in full bloom. Markets broke 200D SMA for DOW and we are closely watching the 17700 level now as resistance and 2070 for the SP500. VIX is elevated and we have to be on our toes. 

We had earnings report from Micron, which were lower than forecast and their outlook was grim. AMD re-enforced the slowdown in the PC markets and we expect the same from the overall semi sector. We stated to go short INTC or SMH and overvalued stocks such as AMBA, SWKS, NXPI and AVGO. We believe INTC buying ALTR was a desperate move from INTC and they paid a hefty premium for this. And as did AVGO buying BRCM for a hefty premium. There is no questions there is a major slowdown in this sector and we do not expect any major driver for this sector. Overcapacity is a definite issue and the phone markets are getting severely saturated in China and India.

Some good reads from this and the past week:


We are long BIDU,CYBR with covered calls written and short INTC,SWKS,AMBA. We went long WBA today for a short term trade. 

We recommend that you hedge your positions by buying some put protection and selling some covered calls. 

Check out some new features on our site and help us spread the word - we rely on word of mouth advertising - we focus our funds on driving development of our site. 

Here are some charts for DIA, SPY, and QQQ - weekly: 


Keep an eye on 50 week SMA for all the above symbols - these are critical support. In addition, watch IBB to see if it closes this week below 13 week SMA - if it does - it is ripe for a short.


Best of luck trading.
Trucharts team.

June 28, 2015

Greece Referendum - How will markets react this week? Trucharts.com Blog - week ending 6/26

Greece Referendum - How will markets react this week? Trucharts.com Blog - week ending 6/26


Well looks like our call on the weakness in the underlying fundamentals of the markets are finally coming to fruition. Earnings from ORCL (ORCL chart), Micron (MU Chart) were pointing to a slowdown in the tech sector - which we alluded to in our blog. 

We stated to take profits and hedge your positions with covered calls or puts a month out for a strike price 5% to 10% below the current prices, for some protection to the down side. INTC - chart below (weekly):


As you may have read in the news INTC is planning layoffs and with the MU news of slowdown in the PC sector we expect that INTC will very likely state the same. The ALTR buyout was primarily to fill their old fabs and they paid a hefty price for ALTR. Seems like a sign of desperation. We will be shorting INTC tomorrow.


Then this weekend we have the news from Greece calling for a referendum. We think the Greek leaders are doing the right thing and letting the people of Greece decide the fate of the country. The creditors are not happy but the choice of cutting back benefits/pensions significantly and hurting the people of Greece is not to be left in the hands of the a few politicians and the Germans. We will have to wait and see how Greece exits the Eurozone - we think they may have already made that decision.

We expect volatility in the markets this week - we alluded to the topping nature of the markets for the past few weeks and how the weakness in the individual DOW component stocks, transportation stocks as a sign of topping behavior. Here is the chart for SPY and DIA (weekly) - notice the weakening technicals (RSI, Moving Averages and MACD) - SPY has not closed below it's 13 week SMA - Chaikin Money Flow is still positive - the next two to three weeks are critical and we have to see if the SPY can hold or bounce of the 50 week SMA. We also stated how the markets have been playing the round number games with the Dow Jones 18000 level, SP500 2100 level and 5000 for the NASDAQ for the past 6 weeks with three digit moves every week.


SPY Chart:                                                            DIA Chart:

SPY chart MACD chart
DIA Chart MACD Chart

SPY support at 208 and DIA support at 177. Here are the daily charts - keep an eye on the moving average support lines:

SPY daily MACD Chart Charting
 DIA daily Chart MACD chart Charting

What to do this week:

1. It is going to be a shortened trading week very likely with low volumes going into     
    the weekend because     of the 4th of July weekend.
2. Sell some covered calls and buy some protection - we are heading into earnings      
    season.
3. Take some profits as we stated earlier - nobody is going to complain or regret 
    locking in some profits.
4. Watch critical support levels for your stocks - you can do this easily with our charts 
     support resistance option on the stock charts page.

Our positions: Long BIDU, CYBR, Z, - short INTC/AMBA. All positions hedged with calls and puts.

On another note here is the chart for IBB ETF (Biotech stocks) - just see it's support level at the 13 week SMA - unbelievable.


We added new features to our site - a quick chart box on the home page and a new chart skin color scheme on the stock charts page - check these out - nice new features to have. The charts we are showing are with the new color scheme.


Some articles for good reading:

http://techcrunch.com/2015/06/26/the-tech-industry-is-in-denial-but-the-bubble-is-about-to-burst/

http://www.businessinsider.com/stock-market-is-a-petri-dish-2015-6

http://www.nytimes.com/2015/06/27/business/international/chinese-stock-indexes-plunge.html


http://www.zerohedge.com/news/2015-06-27/bad-breadth-milestone-warning-stocks


http://www.zerohedge.com/news/2015-06-27/chinas-370-billion-margin-call


http://www.econmatters.com/2015/06/chinese-stocks-how-to-think-like.html


http://www.zerohedge.com/news/2015-06-27/desperate-china-cuts-key-policy-rates-after-stock-market-crash-its-just-1987


http://finance.yahoo.com/video/risky-buyers-making-comeback-housing-233326345.html


http://www.zerohedge.com/news/2015-06-28/ecb-says-greek-bank-holiday-now-necessary


http://www.zerohedge.com/news/2015-06-27/moodys-fitch-fret-over-billions-student-loan-abs-defaults-loom


June 21, 2015

Positioning your portfolio - Summer 2015 and Markets Direction - Blog Trucharts.com

Trucharts.com - Market positioning and where markets are for the summer - Blog Update for Week ending 6/19/2015


Well we guess by now you are all used to the volatility and jerky moves in the markets for the past few weeks. Markets that move sideways for a long period of time are either topping, consolidating, and what we call confused markets. For the past several weeks, we have been seen these wild 3 digit moves up and down and primarily the markets holding the 18000 for the DOW, 2100 for SP500 and now 5100+ for the NASDAQ. This has been occuring every single week. The Russell 2000 hit a new high as did the NASDAQ and everyone is ready to party like its 1999. 

Market pundits are trying to justify why the market valuations are low compared to 2000 - but some of their points sound absurd. Granted there are companies with good earnings and low PE ratios - but these are few and far between. Zero rates from the Fed, market speculators, big firms and heavy stock buybacks are the reasons driving this market and we have shown several examples of charts that look like exponential chart patterns. With everyone chasing performance and yield, stocks have been the only game in town and therefore we are seeing astronomical valuations for many companies - especially in biotech and stocks that are up for no reason (check the charts for stocks (for last 7 years period) like UHAL Chart; SHW chartAMBA chartIBB chartREGN chart and many others. 

Here are the charts for DIA chartSPY chartIWM chart and QQQ chart from the week ending 6/19. You can see the DIA and SPY have not broken out yet and based on the market internals, we are seeing some fundamental weakness in the Industrial stocks, Utility stocks and the individual DOW component stocks - just check here the DOW 30 stocks with the mouseover charts feature: here is the link - DOW 30 stocks - check each chart and you will see how each of these stocks are doing currently.  

As we write, futures are up as Greece is trying to avoid printing drachmas and stay within the Euro zone. This is like the never ending story - it is like a soap opera - with the Greek Prime minister and the finance minister playing lead roles and the Germans are getting tired of it - but do not have a choice but to deal with it.

What should you be doing now: 

We would take a very defensive posture here and take some profits in profitable positions and sell some covered calls, and to protect downside risk with buying some puts on your positions - maybe 10% below (strike price) the current price - these are cheap, knowing that the volatility (VIX) is low and the puts would be cheap insurance. We typically hedge our positions as long and short and try to keep our portfolio balanced. We definitely still think there is risk here on the downside. 

NASDAQ is being hitting new highs primarily because it is being driven by the biotech stocks. These stocks may still go higher, but as they do, so does the risk. In addition, many new IPOs are healthcare related and biotech focused. We would be wary of trading these - unless you have the stomach or risk profile to handle volatile stocks. 

From a stock perspective, we are long BIDU, CYBR, Z, TWTR - we like MO, PM here for short term trades. We missed BTI at 104 (major support). We are short AMBA, and INTC.    
Here is a recap of some of the interesting articles we liked and have provided the links here:

What is the meaning of a "dry-bubble" to VCs?
http://www.zerohedge.com/news/2015-06-17/silicon-valleys-fantastic-dry-bubble

China bubble news:
http://www.zerohedge.com/news/2015-06-20/so-you-think-you-are-rich

California Drought:
http://www.zerohedge.com/news/2015-06-18/california-has-never-experienced-water-crisis-magnitude-%E2%80%93-and-worst-yet-come

TSMC and AAPL news - very interesting read and outlook on semi stocks:

Till next week. 

Good luck trading.

April 19, 2015

Was it a market Correction? Or the start of something bigger?

Market Correction or is the market going to crack here?

Markets on Friday pulled back and broke the 50d and 13d SMA from the wedge pattern we discussed in our last blog. The NASDAQ closed above its 50d SMA. Here are the charts with critical short term trendlines. We expect support for SP500 around 2048 area and for the DOW around 17450. For NASDAQ, around 4850. These will be short term critical support areas. 

There was news on new housing starts which was not good heading into the peak home buying spring season and the housing stocks - check (www.trucharts.com/stockview.aspx?TICK=LEN as an example). Then we had news from Greece and possible default, then the news of the slowdown in China growth and the stock market bubble - investors opened over 4.8M accounts in one week - think about that number 4.8M in one week - Wow!! China is experiencing the same bubbles we had in the US - stocks bubble, housing bubble and then now again stock bubble. There are bubbles brewing everywhere and now for the first time San Francisco median price crossed $1M - this is what happens when money printing machine is running non-stop.


Check the trendlines for the DOW, SP500 and NASDAQ. Watch the levels closely. We have been in a sideways consolidation pattern after the breakout in Oct of 2014. There have been breakouts, but the markets have still been in a sideways pattern. Support for DOW is around 17000, SP500 support is at 1980 area.


With the earnings season in full force there have not been too many surprises - PM raised forecasts and the tech companies have had lackluster earnings - even the forecasts have been muted. We think this is the peak of the tech cycle. 
We are looking to short XLK (www.trucharts.com/stockview.aspx?TICK=XLK
and/or SMH/IPGP (www.trucharts.com/stockview.aspx?TICK=IPGP) for the short term. 

There is a another set of earnings barrage coming next week and the week after - IBM, AAPl, TWTR, YHOO and many more - check this link on our site for the earnings calendar: http://www.trucharts.com/EarningsView.aspx?qst3=qstthisweek.

Our all long portfolio was down only 0.1% on Friday even though the markets were down over 1% each and our long/short portfolio was up 0.5% on Friday. We hedge all our positions and our TWTR position was called away on Saturday. We are long MO, USO, BIDU, TWTR. Short positions are AEM, IBB and SNDK position closed on Saturday.

Check out our special susbscription rates for full access - our features are bar none the best of the web - we are aware of other sites that charge just $35 per month for the real time news feature. Here is the link to our subscription page and our site features:

http://www.trucharts.com/truCharts_Services.aspx

http://truchartscom.blogspot.com/p/why-is-trucharts.html

Good luck trading.

Trucharts Team


February 15, 2015

Trucharts.com Blog - week ending 2/13/2015 and Stocks to Watch

Trucharts.com Blog week ending 2/13/2015

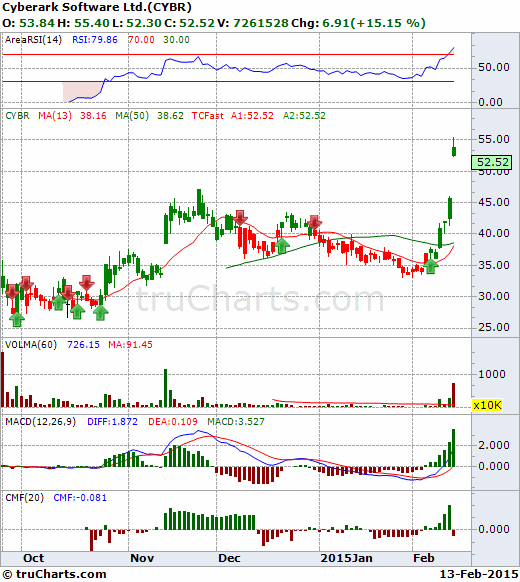
Happy Valentine’s day to all and after a short travel hiatus, we are back to writing our blog. Due to blogging restrictions in China, we were unable to post to our G+, FB and blogger/WP. It feels weird when you cannot blog about just something simple as stocks. Anyway, it has been an exciting week after what we call a consolidation period in the markets. The S&P,NASDAQ and the DOW all hit an all time high – we were expecting the breakout based on the wedge pattern/descending triangle pattern that started in Nov. We expect this to move to last based on the recent earnings and the oil sector bouncing back. Gold pulled back and we expect gold to move down – we think the move up was due to the Chinese New Year. The Greek crisis is just noise and we do not expect this to impact the markets. Oil is in a bottoming phase and we will watch this closely – our picks LINE, USO and OIL jumped very nicely (over 30% for LINE and OIL etf), our GM short and F short will be rolled over to next month. We expect this to be a peak year for auto sales. Our pick CYBR did very well as did TWTR – both of these are up over 40% CYBR and 20% TWTR since our calls and check out the buy signal for CYBR on our buy/sell strategy chart below:

Check the Chaikin money flow Index on the bottom of the chart – it went negative when the stock gapped up on Friday. Based on our technical analysis, we would expect the stock to pull back/consolidate and make a move higher. The earnings were announced on Thursday after the close and the company crushed the earnings and guided higher.
CYBR Stock Chart

CYBR _ WITH BUY/SELL SIGNALS

TWTR also reported good earnings and that moved higher and we are still expecting a move higher in TWTR. 

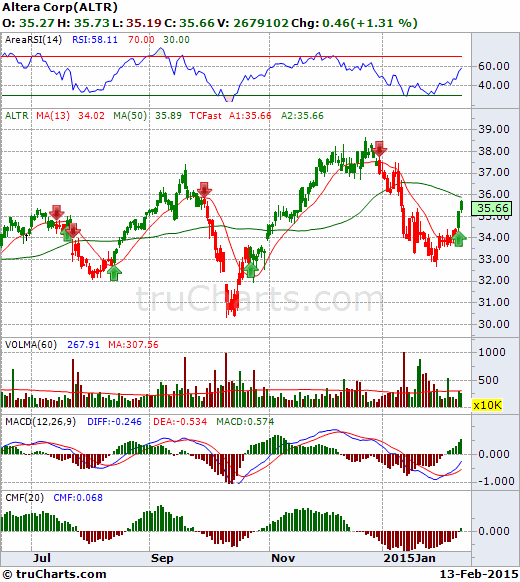
We went long ALTR based on the technicals. Here is the chart for ALTR. We will exit the position this week around 36.25 or better.

ALTR Stock Chart
We went long AMKR, are long USO/LINE and are watching the following stocks closely next week:

http://www.trucharts.com/stockview.aspx?TICK=VFC (which went buy signal right before the gap up)
Markets are closed for President’s day – Monday. Good luck trading and check out our multiple charts feature and also our real time categorized news feature.

We closed our position in K (Kellogg) right before it gapped down on Friday – looks like people are not eating enough cereal!!

Our call on DAL short was right on the money - we closed that position this week.

Trucharts Founder

January 28, 2015

Trucharts.com Market closing update - 1/28/2015


Free Stock Charts/ETFs/Dividend stocks at Trucharts.com: Auto Stock Buy/Sell signal strategies - check out our site - free 30d trial:

Well another down day after Fed speak and the techncial picture is getting weaker. Read this article - a very good read on the market technicals: http://finance.yahoo.com/news/too-already-bear-market-110124065.html.

We stated we never have our portoflio all long or all short. We were hedged but stayed with our shorts - GM, F, IBB and DAL. We closed our YHOO short early. Our long side of portfolio was hedged with covered calls and today's weak close was not a good sign. 

OIL is getting crushed and our USO position is not looking strong. We will hold on as the bearish sentiment on oil is growing day by day. We now expect that oil will go to 40 possibly. Gold was down and we are short AEM. 

The market has been going through a tug of war between the bulls and the bears and looks like right now the bulls are losing. Earnings have been mediocre and a few companies are either beating or rasing their forecasts. Majority of the forecasts have been down for this year. Well what this tells us is that the economy is going to see some challenges this year and the world economies are in for a challenge. 

The Greek anti-austerity party victory is driving up the Greek bond yields - expect some fire crackers from the Euro zone - what happens if Greece decides to break away from the Euro zone. Who is next? 

We still want to stay short GM, F and AEM. We will sit and wait tight with our USO position and average down when the dust is cleared. 2000 onthe S&P has been the line in the sand - we will have to watch this 2000 mark and see if the S&P can hold or break it.

AAPL stock was up today and YHOO pulled back - FB still looks like a great short - overvalued company.

January 25, 2015

Trucharts.com Hot Stocks and Stocks to watch - Weekly Blog update - week ending 1/23/2015

Trucharts.com Weekly Blog update - week ending 1/23/2015


A shortened week and the Draghi moment on Thursday when the markets were up nicely after another round of QE was announced 1 Trillion Euros – all central banks are printing money and there is no stopping – low interest rates (negative in the Eurozone) and then we have stock bubbles and ZIRP in US is showing up as bubbles in stock valuations and real estate. We do not expect the Fed to do anything this year on the Fed Funds rate and Draghi is bent on destroying the Euro (which incidentally is at 1.115 to the USD) – now European vacations are going to be lot cheaper. And then we had the Greek election and the drum roll please !!! – the anti austerity party won the elections – what a surprise!! Are the Greeks going back to the drachma??
Enough politics – what does this do to the markets – the move up on Thursday was a big move and the move down on Friday looked like a consolidation move and the trend is still intact – the RSI and MACD is moving higher and we think oil is vacillating within a tight range, and gold is also consolidating. Keep an eye on gold and oil. There are over 1300 companies reporting earnings this week. AAPL is on top of the list and as are many big names. Check out the earnings calendar on our site at:http://www.trucharts.com/earningsview.aspx and also we provide the earnings date for any stock on the stock charts page. Futures are pointing to a lower open, but we expect the AAPL earnings maybe the catalyst and Fed speak is what is going to drive the markets.
We are short GM, F, IBB, DAL (sold some puts also)  and long USO, WSM, K, CYBR, LINE and went long BOX on Friday. Our ALTR short was a good call and GM calls expired. Our Trucharts.com BUY/SELL strategies are working well and we are using these to make trade decisions along with watching the technicals closely. There will be a lot of noise during the earnings season, so be watchful. Here are some stocks we like: K, and the list below – futures are down this morning – so be careful with your entry and keep tight stops – the trend is still up and we think until the Fed speaks we may see some volatility.
BABA104.0200105.2000103.0200103.1100104.00009847987
CME88.500088.940087.680088.510088.57001058695
EBAY56.990057.280056.310056.760057.150013357022
ETFC23.900024.970023.780024.560022.650012271579
EXPE84.330088.650084.140087.440085.71003679708
HON101.1100103.9200100.5000102.410099.39005209857
HPQ39.960040.250039.760040.100040.06006171057
IWM118.3400118.7700117.5500118.1300118.200026223219
MNKD5.59005.80005.51005.74005.57004143225
NOW66.590069.500066.550068.740066.14001015475
SNPS43.200043.850042.900043.530043.1700448589
VLO48.150050.900047.740050.160048.000011559865
Check our Reports section for many other picks in the MACD bullish crossover reports and others.
Please spread the word and invite your friends to use the site and take advantage of out recommendations and site features.
Trucharts CEO and Founder
Bob Bhatia