Go Daddy Signup

Showing posts with label BIS. Show all posts

September 27, 2015

NASDAQ,DOW and SPY where are these headed? What to do with your portfolio? Trucharts Weekly Blog

Trucharts Weekly Blog

NASDAQ,DOW and SPY where are these headed? What to do with your portfolio?


Sorry that we were unable to publish our blog last weekend due to some family commitments. Well the Fed speech impact was short lived and then volatility picked up in the past week and the biggest standout was the biotech sector which had driven up the NASDAQ to its 2000 highs and everyone on TV was still bullish on biotech sector. As much as we like some stocks in the drug sector and the biotech sector, the valuations were not justified - in addition, we were seeing heavy insider selling in many companies. Many biotech companies with no revenues were showing exponential charts and if you recall how we warned about exponential charts - these always are a bad sign of things to come. Just check out some of the high flyers in the biotech sector. We were also seeing weakening technical signals in the ETF IBB when it was hitting new highs.


Check these stocks:

www.trucharts.com/stockview.aspx?TICK=BLUE
www.trucharts.com/stockview.aspx?TICK=ICPT

and then there are many more in this sector that would move on the smallest drug news. Absolutely ridiculous. We have been saying to keep and eye on the 50 week SMA for ETF IBB (which we have been short), and sure enough once it broke the line in the sand it cascaded down and now it is a pure short. We are stil short but we are long BIS (short ETF) which closed for the first time above 50 week SMA - here is a comparison chart (IBB vs BIS). Check the BIS volume - highest ever.

We also have the chart here for the buy/sell signals for IBB on weekly chart - see below (this feature is provided to our registered/subscribed users). We think IBB is headed to around 260 - 280 range. There will be margin calls on folks who are long biotech stocks.


Now where do we think the markets are headed - gold moved up after Godmother Yellen spoke on Thursday that rates would rise in 2015 and markets were up in on Friday early and then pulled back later in the afternoon. We believe the institutions are moving into the comfort of consumer cyclicals, staples and high divided yielding stocks in sectors that are still strong. We are concerned that we may see dividend cuts in the stocks of oil companies - just a guess - but with oil down - there is no way these companies can sustain such high payouts. In addition, we expect massive layoffs and the oil states economies will be affected (Texas, Louisiana and others). We like NKE after their earnings report. We hav been playing with NFLX and are short FIT/GPRO (valuation too high). We expect the DOW to stay range bound 15000 - 17000 for some time here, SPY is headed to around 1750 - current price is 192.85. We would be very careful here - SPY and DIA have broken 100 week SMA. 

China slowdown has now shown up in 2 major equipment suppliers - JOY and CAT. CHina is definitely slowing down and we have to see if they are headed the way of Japan. In addition, the central banks are still running loose with money printing and it seems to be helping the top 1% only. Brazil is going to the dogs with its credit rating cut. The rates for 10 year bonds in Brazil have shot up to 16% - want buy some Brazil debt - anyone? We would stay away from these stocks. We like gold stocks - but we need to see high volume breakout - we are not there yet. We encourage to write covered calls on your positions - that is what we have done and that has protected our portfolio. The trend is down. The ony thing in favor of the indices is the RSI is oversold - but needs to consolidate. Here is weekly chart for SPY:


Check out our site features at the best subscription rates in the industry and on the web:


Good luck trading.

Stay nimble.

Trucharts Team and Founder/CEO


May 31, 2015

Markets Direction - Up or Down? Where are we headed? Trucharts.com Blog Update

Markets Direction - Up or Down? Where are we headed? Weekend Blog Update week ending 5/29/15

We have not had a chance to do a weekend update due to the jet lag from travel and other pressing matters. Finally getting some time to put my thoughts down related to the markets from the past 3 weeks and heading into the summer session.

Well NASDAQ hit a new high, markets moved higher and many earnings were reported. Avago bought Broadcom - a $37B acquisition (we think they paid too much - almost 5.5x sales) and then we have Intel buying ALTR this week - from an earnings we had HD, LOW and many other companies that reported earnings in the past couple of weeks. ULTA also reported but the stock reversed after reporting its earnings as did HD. There is talk of additional mergers in the semi company space - here are the companies that we think are ripe for consolidation - MXIM, IDTI, TXN, SLAB, MCHP, ADI, NVDA, AMD, SWKS, MRVL, XLNX, AMBA and probably many others we are missing.  Keep an eye on these stocks. NXPI, AVGO, INTC and other big semi companies would be possible acquirers. With the AVGO and BRCM merger - the merged company will be the 3rd largest semiconductor company after INTC (1) and QCOM (2).

Our drug stock picks LLY, MYL and TEVA still holding strong. The biotech sector has been holding the NASDAQ up and we expect that this sector will eventually fall - we just cannot predict when - there is technical weakness in the ETFs in the biotech sector.

We are very concerned about the underlying weakness in the markets - structurally. We are seeing many stocks breaking down in the DOW and S&P500. In addition, stocks are reversing after reporting earnings - check HD, ULTA. Housing stocks are dropping - indicating that the markets are anticipating rate hikes from the Fed. We think the Fed sees an asset bubble and are being left with no choice but to start raising the Fed funds rate. Housing prices are moving up. unemployment is down to 5.3%, homes on the west coast are selling at prices higher than asking - and this has been the longest period for the rates being at near zero - now close to 6+ years and over the past week we posted an article on FB and G+ where Byron Wein discusses how the Fed has pumped over $3T into the markets - we concur. And then we see this article over the weekend:

All these are pointing to over valuation in the markets and the complacency is remarkable. The VIX was down last week and we expect this to spike higher in the coming weeks. We stated that we would take profits here and hedge positions with calls and puts. Adding some shorts is in our plan for the coming week.  We are long BIDU, TWTR, Z (all hedged with covered calls) and are looking to short MSFT, and possibly IBM. 

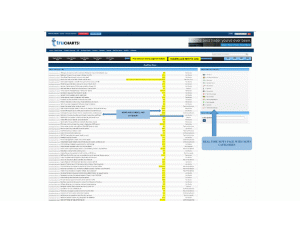
Just take a look at the stocks that popped on our sell signal strategy here:Just sort the page by volume from highest to lowest by clicking on the volume column twice: 

Watch for our regular daily posts and positions updates on Twitter and FB.

Again - watch the Greek situation, China stock bubble, and sell here to take some profits and wait for a better opportunity.

Good luck trading. Check out our special subscription rates and we offer the best feature set on the web for our lowest subscription rates - here is the link: 

Do checkout our backtest feature - it is the fastest on the web and ummatched by any site.
Link is: Backtest feature - play with it and you can use it to try some paper trades.

Please help by spreading the word of our site.

Trucharts founder and team

April 5, 2015

How to trade this week after the bad jobs report?

Trucharts.com - Blog - Easter Weekend - Stock Charts Free - and more.

How to trade post Easter and what to expect?

We talked about the horrendous job reports we got on Friday in our last blog update - just a reminder the reports showed 126K jobs created vs the expectations of 226K. Futures dropped on the news and the USD dropped - gold rallied and then we had oil rallying this weekend with the Saudi's raising the price of oil to the Asian nations because of demand. In addition, we have the nuclear deal with Iran and then the war going on in Yemen - this is definitely going to impact the oil price volatility. Gold is up today over $12+.

The talking heads on TV are already trying to predict the Fed's move in Q3 and we still expect that the Fed will raise rates in Q3 unless the jobs report stays below 150K. With summer coming, we expect the jobs report to improve going forward. 

Futures are down this evening (DOW futures down -115) after recovering from a 200 point drop and everyone is already trying to predict whether the Fed is going to hold off on raising rates based on one jobs report (which we think is a blip) and should resume an upward trend next month. The weather did have an impact and we suspect hiring in the oil sector was down. 

We indicated that the earnings news has not been very encouraging and we expect that the forecast for the tech sector for Q2 will not be strong. With INTC and SNDK lowering revenue forecasts, we expect numbers to be coming down in the tech sector - recommend taking profits in this sector. We are looking to short TSM and SPIL.

Since we now have to wait till the next jobs report, we expect that bonds will rally here and yields will drop and this will help the utility and dividend paying stocks to shine at least for the short term, in addition to retail/housing stocks. We like the following stocks:

MO - (we are long) www.trucharts.com/stockview.aspx?TICK=MO
RAI - www.trucharts.com/stockview.aspx?TICK=RAI
LO - www.trucharts.com/stockview.aspx?TICK=LO
M - www.trucharts.com/stockview.aspx?TICK=M
PHM - www.trucharts.com/stockview.aspx?TICK=PHM

We are short SNDK, and long USO, BIDU, MO, TWTR. We still like TWTR and you can also check out our predefined scans report on our site at www.trucharts.com/marketreports.aspx.

Also check out our special subscription deals for complete access to our site at:
www.trucharts.com/charts_services.aspx

Good luck trading.

Trucharts Team

January 28, 2015

Trucharts.com Market closing update - 1/28/2015


Free Stock Charts/ETFs/Dividend stocks at Trucharts.com: Auto Stock Buy/Sell signal strategies - check out our site - free 30d trial:

Well another down day after Fed speak and the techncial picture is getting weaker. Read this article - a very good read on the market technicals: http://finance.yahoo.com/news/too-already-bear-market-110124065.html.

We stated we never have our portoflio all long or all short. We were hedged but stayed with our shorts - GM, F, IBB and DAL. We closed our YHOO short early. Our long side of portfolio was hedged with covered calls and today's weak close was not a good sign. 

OIL is getting crushed and our USO position is not looking strong. We will hold on as the bearish sentiment on oil is growing day by day. We now expect that oil will go to 40 possibly. Gold was down and we are short AEM. 

The market has been going through a tug of war between the bulls and the bears and looks like right now the bulls are losing. Earnings have been mediocre and a few companies are either beating or rasing their forecasts. Majority of the forecasts have been down for this year. Well what this tells us is that the economy is going to see some challenges this year and the world economies are in for a challenge. 

The Greek anti-austerity party victory is driving up the Greek bond yields - expect some fire crackers from the Euro zone - what happens if Greece decides to break away from the Euro zone. Who is next? 

We still want to stay short GM, F and AEM. We will sit and wait tight with our USO position and average down when the dust is cleared. 2000 onthe S&P has been the line in the sand - we will have to watch this 2000 mark and see if the S&P can hold or break it.

AAPL stock was up today and YHOO pulled back - FB still looks like a great short - overvalued company.

January 25, 2015

Trucharts.com Hot Stocks and Stocks to watch - Weekly Blog update - week ending 1/23/2015

Trucharts.com Weekly Blog update - week ending 1/23/2015


A shortened week and the Draghi moment on Thursday when the markets were up nicely after another round of QE was announced 1 Trillion Euros – all central banks are printing money and there is no stopping – low interest rates (negative in the Eurozone) and then we have stock bubbles and ZIRP in US is showing up as bubbles in stock valuations and real estate. We do not expect the Fed to do anything this year on the Fed Funds rate and Draghi is bent on destroying the Euro (which incidentally is at 1.115 to the USD) – now European vacations are going to be lot cheaper. And then we had the Greek election and the drum roll please !!! – the anti austerity party won the elections – what a surprise!! Are the Greeks going back to the drachma??
Enough politics – what does this do to the markets – the move up on Thursday was a big move and the move down on Friday looked like a consolidation move and the trend is still intact – the RSI and MACD is moving higher and we think oil is vacillating within a tight range, and gold is also consolidating. Keep an eye on gold and oil. There are over 1300 companies reporting earnings this week. AAPL is on top of the list and as are many big names. Check out the earnings calendar on our site at:http://www.trucharts.com/earningsview.aspx and also we provide the earnings date for any stock on the stock charts page. Futures are pointing to a lower open, but we expect the AAPL earnings maybe the catalyst and Fed speak is what is going to drive the markets.
We are short GM, F, IBB, DAL (sold some puts also)  and long USO, WSM, K, CYBR, LINE and went long BOX on Friday. Our ALTR short was a good call and GM calls expired. Our Trucharts.com BUY/SELL strategies are working well and we are using these to make trade decisions along with watching the technicals closely. There will be a lot of noise during the earnings season, so be watchful. Here are some stocks we like: K, and the list below – futures are down this morning – so be careful with your entry and keep tight stops – the trend is still up and we think until the Fed speaks we may see some volatility.
BABA104.0200105.2000103.0200103.1100104.00009847987
CME88.500088.940087.680088.510088.57001058695
EBAY56.990057.280056.310056.760057.150013357022
ETFC23.900024.970023.780024.560022.650012271579
EXPE84.330088.650084.140087.440085.71003679708
HON101.1100103.9200100.5000102.410099.39005209857
HPQ39.960040.250039.760040.100040.06006171057
IWM118.3400118.7700117.5500118.1300118.200026223219
MNKD5.59005.80005.51005.74005.57004143225
NOW66.590069.500066.550068.740066.14001015475
SNPS43.200043.850042.900043.530043.1700448589
VLO48.150050.900047.740050.160048.000011559865
Check our Reports section for many other picks in the MACD bullish crossover reports and others.
Please spread the word and invite your friends to use the site and take advantage of out recommendations and site features.
Trucharts CEO and Founder
Bob Bhatia

January 6, 2015

Trucharts.com Stocks to Watch and markets 1/6/2015

Trucharts.com Stocks to Watch and markets 1/6/2015


Stock Charts Free, Stock Scans at TruCharts.com, Dividend stocks: Closed our ALTR short today and went short F (Ford Motor Co). Expect volatility to stay high and MU revenue forecast was lower than Street Expectations. Take profits in semi-sector now - Biotech breaking down - take profits. We are short GM,F and DAL. Long WSM, AMKR and LINE, CYBR, HMY. Check out our buy/sell signals on our stockview page - www.stockcharts.com/stockview.aspx.

Chart for MU: www.stockcharts.com/stockview.aspx?TICK=MU

December 15, 2014

Brief Update on Markets 12/15/2014


Free Stock Charts/Scans/Stock Screener at Trucharts.com - 


We talked about gold pulling back and being short IBB - both of these are moving down and the commodity complex breakdown is going to affect gold and gold miners. Russian ruble has completely crashed and is now worse than the Indian Rupee. Amazing what US political power can do. Short AEM, GM and IBB, long BIS and WSM.


Markets were up and everyone was getting excited this morning. Then we had a pullback and we need to wait and see if the markets consolidate here.

Trucharts team

November 16, 2014

Trucharts.com Stocks to Watch and Markets Blog Update Week ending 11/14/2014

Trucharts.com Markets Blog Update Week ending 11/14/2014

Markets have been vacillating and staying within a very tight range and always moving higher into the close. The VIX gets slammed at the end of the day and the markets bounce back – even though we are seeing narrow breadth and narrow leadership in the stocks driving the markets. We have ramped very fast from the correction in October and the markets appear to be topping out here. Individual stocks have been seeing some movement – but no sector other than the transports stands out. There is no question that this is definitely a trader’s dream come true – stocks move quite nicely and smart traders (day traders and short term traders) are taking advantage of this volatility in the stocks. Take a look at the stocks like Z, AMZN, BIDU, TSLA and many more momo stocks.
Our sentiment indicators are showing that the markets will stay within a tight range and, as we stated in our earlier blogs, markets will not correct into the Thanksgiving holidays. We can expect volatility but no major moves (unless there are black swan events). The GOP is going to take some time off from their victory in the mid-term elections and come back with a fresh agenda in January and let the President take it easy for the holidays.
The move in gold this Friday looks like a BULL trap – be mindful – the trend is still down and the move in the gold miners also was not on convincing volume. We would sell into the gold rally – the move was due to the coming referendum in Switzerland for the repatriation of their gold. We do not expect this to pass, and the day the this does not pass – watch gold – we think it will drop over $100 (just our speculation). We are short AEM and will stay short. Our prediction for gold price is still at least $1000.
Our IBB short is still in play and we expect the BIOTECH unwinding to start – it started on Friday. Mutual Funds will start to take profits in this sector and will try to show good performance into the end of the year.
The China stock market is coming off a bottom and since the link with the Hong Kong stock exchange, the China ADRs have been moving up quite well.  Surprisingly, we missed BIDU but we have been long JRJC (www.trucharts.com/stockview.aspx?TICK=JRJC) and are looking for stocks in the China ADRs for good buy candidates – we like WUBA – here is the chart – check the weekly and daily chart – (www.trucharts.com/stockview.aspx?TICK=WUBA). Check the weekly technicals:
Here is the chart for reference:
WUBA Stock Chart
We have a special offer for the holidays on our yearly subscription – 50% discount – check this at the following link:
The following is the list of stocks we will be watching this week:
Z                    - www.trucharts.com/stockview.aspx?TICK=Z
TRLA              - www.trucharts.com/stockview.aspx?TICK=TRLA
CYBR, WIFI, TWTR.
We are long CYBR. We closed our USO position at a loss - we were stopped out of the position. Always remember capital preservation is key.
Here is the Help file image for our real time news page:
Stock Market Real time News - Trucharts.com
Trucharts.com Realtime News Help

November 14, 2014

Trucharts.com Biotech sector Update


Stock Charts - Free - Trucharts.com - We have been short IBB and biotech sector - check these stocks out today BIIB - down 14 and we think this sector is overbought and ripe for shorting now.  Long BIS/Short IBB.

October 14, 2014

Stock Charts Free - Trucharts.com - IBB chart update

TruCharts.com Blog Update for ETF IBB

Check out this chart for IBB - next support is at 50 week moving average.  Note the RSI and MACD for weekly -  If it breaks and closed below the 50 week - next support is at 220.


October 12, 2014

Stock Charts - Trucharts.com - Blog Update ending 10/10/14

Trucharts.com - Blog Update week ending 10/10/2014


Well what a volatile week this was.  Markets ended on a weak note on Friday.  We stated last week that volatility was high and that it would pull back - well we did get a pullback on Monday but then it moved up significantly by Friday.  There were huge moves in the markets and in oil.  Oil closed below the $85 mark.  Many oil drillers and stocks related to the oil industry are crashing and we think this well affect the Texas economy significantly.  Last week we showed some very good charts on the markets - we indicated that there was underlying technical weakness even as the markets were moving higher.  The RSI and MACD were weak and this is where techncial analysis becomes very useful. We believe that there is incessant selling in the oil stocks due to margin calls.  Just check the stock charts for APC, CLR, APA, HAL and many more.

The gold miner stocks are also getting crushed.  We still like gold - we suspect it has bottomed here for a short time - but the long term trend is showing a possible price target of $1000.  We will keep a close eye on this.
Last week there was news from Microchip (MCHP) that affected the semiconductor sector.  We had been short SNDK and SIMO.  We think this is real weakness and expect this to continue through into 2015.  Check the charts for NXPI, AVGO, LLTC, XLNX, LRCX, KLAC and many more in this sector at: www.trucharts.com/stockview.aspx.  This sector is in major correction mode as is the NASDAQ.

We indicated that we would be shorting HPQ, SNDK, GM and we took short positions in these stocks.

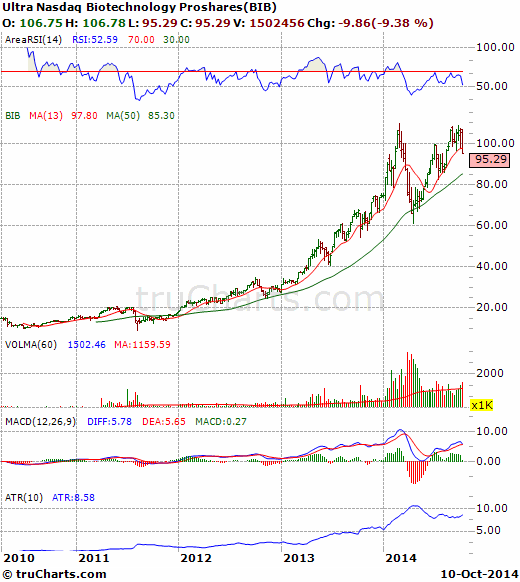
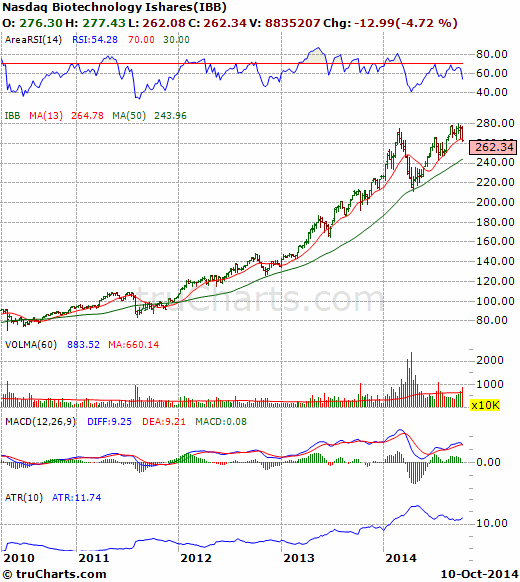
Now for the next sector which we have been indicating is in bubble mode and should see a correction or major pullback - we are long BIS and short IBB.  We have been showing these charts for the past 2 weeks.  Here is the chart for IBB and BIB - note the close belowe the 13 week average for the first time in over 12 weeks - also note the technical weakness in the RSI/MACD and volume. The next support is at the 50 week moving average.

BIB stock chart
BIB weekly close
Stock Chart IBB weekly
IBB weekly chart

October 11, 2014

Brief update - TruCharts.com - Week ending 10/14/2014

Brief Update - Week ending - 10/10/2014 - Stock Charts/Stock Scans

Check this chart for biotech ETF IBB - closed below 13 week moving average for 1st time in around 12 weeks. This is a major short - see the MACD and RSI - close your biotech stock positions - this sector is going down - short IBB and biotech sector. We are short GM/HPQ/SNDK and biotech sector.  Next test level will be the 50 week moving average - around $244.  Watch this level closely.

Here is the chart:

IBB ETF - Weekly Chart

October 10, 2014

Stock Charts - Trucharts.com - Blog update 10/10/14

Free Stock Charts - Trucharts.com -  We have been saying sell into rallies and sell biotech stocks.  We are short IBB and GM/HPQ.  Expect this downdraft to continue.  Take profits now. 

September 4, 2014

TruCharts.com:  Update 9/4/2014


Stock Charts: Tecnhical Analysis:  So we talked about closing of our BP position last week and that was the correct call.  In addition, we have been saying take profits in the BIOTECH sector stocks and these are pulling back today.  We would continue to take profits here.

TruCharts team

September 3, 2014

truCharts.com; Stock Charts update 9/3/2014

Stock Charts - truCharts.com - Update 9/3/2014


The DJIA and the SPY are moving within a very tight range for the last few days since the close above 2000.  There may still be legs in this rally, but we advise taking profits in at least half of your positions and watch oil closely today - coming off an oversold condition - check USO and OIL - we still like these from a technical analysis point of view.  BIOTECH rally is running out of steam here - very overpriced sector and over hyped.  We will go long USO (full disclosure) end of day today and are long TUBE, BIS and YHOO.  We will publish a technical update on the indices this week and show some technical divergences.

TruCharts team
www.trucharts.com