Trucharts.com - Blog Update week ending 10/10/2014
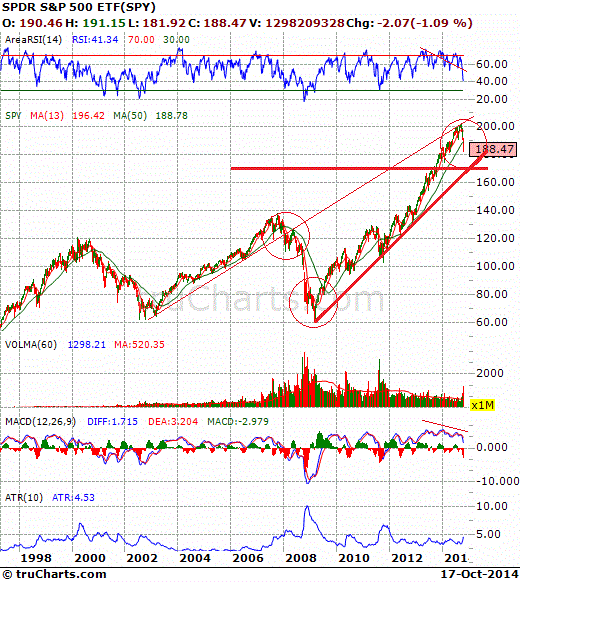
Well what a volatile week this was. Markets ended on a weak note on Friday. We stated last week that volatility was high and that it would pull back - well we did get a pullback on Monday but then it moved up significantly by Friday. There were huge moves in the markets and in oil. Oil closed below the $85 mark. Many oil drillers and stocks related to the oil industry are crashing and we think this well affect the Texas economy significantly. Last week we showed some very good charts on the markets - we indicated that there was underlying technical weakness even as the markets were moving higher. The RSI and MACD were weak and this is where techncial analysis becomes very useful. We believe that there is incessant selling in the oil stocks due to margin calls. Just check the stock charts for APC, CLR, APA, HAL and many more.
The gold miner stocks are also getting crushed. We still like gold - we suspect it has bottomed here for a short time - but the long term trend is showing a possible price target of $1000. We will keep a close eye on this.
Last week there was news from Microchip (MCHP) that affected the semiconductor sector. We had been short SNDK and SIMO. We think this is real weakness and expect this to continue through into 2015. Check the charts for NXPI, AVGO, LLTC, XLNX, LRCX, KLAC and many more in this sector at: www.trucharts.com/stockview.aspx. This sector is in major correction mode as is the NASDAQ.
We indicated that we would be shorting HPQ, SNDK, GM and we took short positions in these stocks.
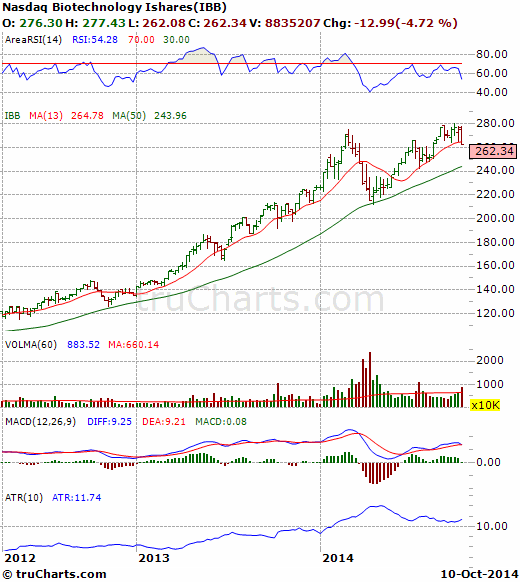
Now for the next sector which we have been indicating is in bubble mode and should see a correction or major pullback - we are long BIS and short IBB. We have been showing these charts for the past 2 weeks. Here is the chart for IBB and BIB - note the close belowe the 13 week average for the first time in over 12 weeks - also note the technical weakness in the RSI/MACD and volume. The next support is at the 50 week moving average.
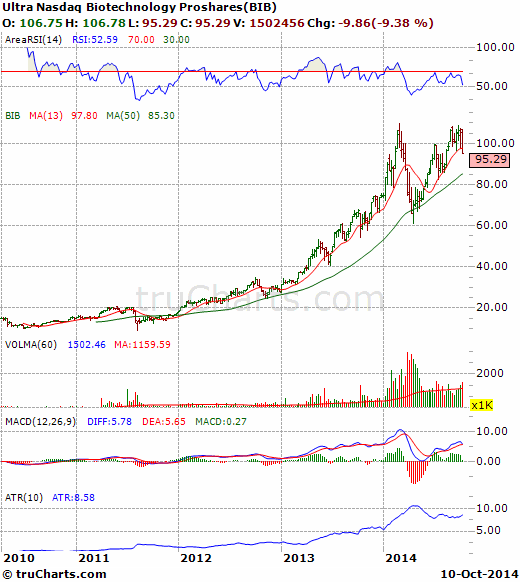
- BIB weekly close
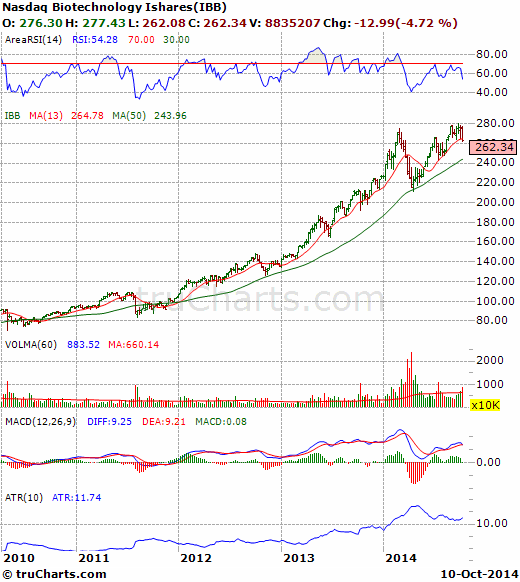
- IBB weekly chart