Trucharts.com Blog week ending 4/24/2015
Free Stock Chart(s), Technical Screener, MACD Charts, Scanner, Real Time Stock News, Stock Patterns, Stock Quotes, Portfolio Management, Earnings Calendar and more:
Well the stock markets have been going through a nice up trend with this earnings season in full force. Stocks in many sectors were rocking and not so in some sectors. The technology semiconductor sector looks like it has topped out in earnings - check how AVGO, NXPI, TXN (reported earnings and tanked) and many others are pointing to a slowdown in this sector. We were short SMH and recommending shorting NXPI and AVGO in our last blog. We would stay short SMH.
In addition, next week we have the moment of the quarter earnings from AAPL on Monday and then TWTR on the 29th (and BIDU also). FB (Facebook) earnings did not look strong and we still do not like FB due to its valuation. Google stock moved, primarily due to short covering. AMZN was a blowout - unfortunately we think here it is expensive here - even though it may move higher. The earnings will keep going this week and you can check the earnings calendar for your stock on our stockview page in the data box and on our earnings calendar page at: Earnings Calendar.
Here is a stock we talked about shorting and looks like a great candidate for short - please always hedge your position by buying an out of the money call. We always hedge our positions. Stock is IPGP and here is the chart:
Stock is closed below 13d and 50d SMA - target would be 85 and below.
Gold got killed last week but we think this is going to be range bound from $1100 to $1200 and we will keep a close eye on this. Some commodity stocks did well this past week - check out RS, VALE.
Markets are still trending higher - we think there is a chance for a breakout here and we have to see if there is follow through. Chinese markets are on a roll - bubble brewing but not over yet.
Now how did we make 18% - we traded TWTR stock - TWTR has been range bound between 49 and 53 and we bought the stock for 3 weeks in a row and wrote the covered calls for each of those weeks, since TWTR has weekly options. We traded 400 share blocks and our investment was $10000 and our net profit was $1800. Total return - 18%. We are still long TWTR and plan to stay long into earnings - we think TWTR is beating FB (facebook) and is growing now. We will write covered calls for next week May 1st - Friday for part of our position. Anyway - I wil be traveling this week and will still try to publish and update the blog next weekend. Check out our site for excellent real time stock news and excellent features like mouseover charts/automated buy and sell signals for any stock which you will find on no other sites. We charge the lowest subscription fee for full access to our site. We need your support and we have been providing actual trades and the best picks for the last 6 months - all for free.
Showing posts with label AMZN. Show all posts
Showing posts with label AMZN. Show all posts
April 26, 2015
We made over 18% in three weeks? What did you trade?
November 16, 2014
Trucharts.com Stocks to Watch and Markets Blog Update Week ending 11/14/2014
Trucharts.com Markets Blog Update Week ending 11/14/2014
Markets have been vacillating and staying within a very tight range and always moving higher into the close. The VIX gets slammed at the end of the day and the markets bounce back – even though we are seeing narrow breadth and narrow leadership in the stocks driving the markets. We have ramped very fast from the correction in October and the markets appear to be topping out here. Individual stocks have been seeing some movement – but no sector other than the transports stands out. There is no question that this is definitely a trader’s dream come true – stocks move quite nicely and smart traders (day traders and short term traders) are taking advantage of this volatility in the stocks. Take a look at the stocks like Z, AMZN, BIDU, TSLA and many more momo stocks.
Our sentiment indicators are showing that the markets will stay within a tight range and, as we stated in our earlier blogs, markets will not correct into the Thanksgiving holidays. We can expect volatility but no major moves (unless there are black swan events). The GOP is going to take some time off from their victory in the mid-term elections and come back with a fresh agenda in January and let the President take it easy for the holidays.
The move in gold this Friday looks like a BULL trap – be mindful – the trend is still down and the move in the gold miners also was not on convincing volume. We would sell into the gold rally – the move was due to the coming referendum in Switzerland for the repatriation of their gold. We do not expect this to pass, and the day the this does not pass – watch gold – we think it will drop over $100 (just our speculation). We are short AEM and will stay short. Our prediction for gold price is still at least $1000.
Our IBB short is still in play and we expect the BIOTECH unwinding to start – it started on Friday. Mutual Funds will start to take profits in this sector and will try to show good performance into the end of the year.
The China stock market is coming off a bottom and since the link with the Hong Kong stock exchange, the China ADRs have been moving up quite well. Surprisingly, we missed BIDU but we have been long JRJC (www.trucharts.com/stockview.aspx?TICK=JRJC) and are looking for stocks in the China ADRs for good buy candidates – we like WUBA – here is the chart – check the weekly and daily chart – (www.trucharts.com/stockview.aspx?TICK=WUBA). Check the weekly technicals:
Here is the chart for reference:
We have a special offer for the holidays on our yearly subscription – 50% discount – check this at the following link:
The following is the list of stocks we will be watching this week:
CYBR, WIFI, TWTR.
We are long CYBR. We closed our USO position at a loss - we were stopped out of the position. Always remember capital preservation is key.
Here is the Help file image for our real time news page:
(check this out at): http://www.trucharts.com/RealTimeNews.aspx
 |
| Trucharts.com Realtime News Help |
November 14, 2014
Trucharts.com Buy Strategy signal for AMZN
Trucharts.com AMZN stock update:
Stock Charts - Predefined Stock Scans - Trucharts.com - AMZN stock update: (Stock Trading Strategy); StockScreener.
Check here below our buy/sell strategy for AMZN - we had a buy signal around 305 and today the stock is up to 327 a move of over 5% in less than 4 days - this strategy is available for free at our site for registered subscribers.
 |
| AMZN Stock Chart with BUY signal |
Trucharts.com Biotech sector Update
Stock Charts - Free - Trucharts.com - We have been short IBB and biotech sector - check these stocks out today BIIB - down 14 and we think this sector is overbought and ripe for shorting now. Long BIS/Short IBB.
November 5, 2014
AMZN BUY/SELL signal at Trucharts.com
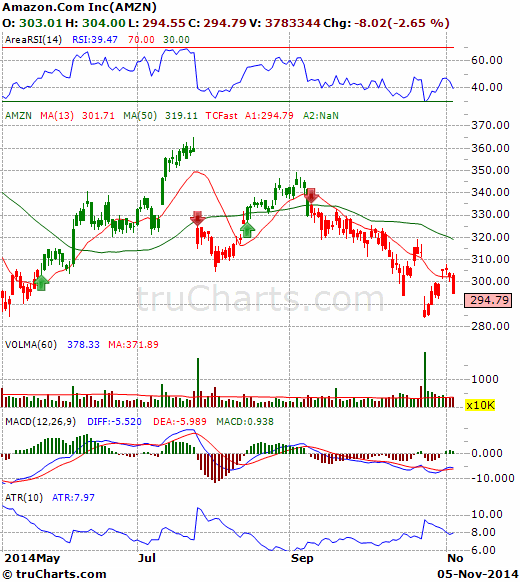
Check here below and see where our site trading strategy put a SELL signal for AMZN and could have saved a ton of money or made money for folks that shorted the stock. Red arrows point to SELL.
Subscribe to:
Posts (Atom)


