Go Daddy Signup

Showing posts with label Stock Market. Show all posts

December 5, 2014

Jobs Jobs and more Jobs

Stock Charts - Free and Charting at Trucharts.com: Well what a blowout jobs report - our estimate was 240K and one of the highest estimates and the job reports came in at over 320K. This is good news for the economy but will put pressure on the Fed to raise rates next year. We still do not think this will happen due to the other world economies - but will definitely not spur a QE event. Markets are consolidating here - strong season for markets - we expect new highs. 

Expect stocks to consolidate here.  We will publish a stock to watch list later today.

December 4, 2014

Today's market stats 12/04


Stock Charts Free, Charting / Predefined Stock Scans at TruCharts.com


Today's market stats 12/04 - Markets closed slightly lower from yesterday's close. There was a dip in the morning and then the markets recovered due to some rumor that QE was to be announced by EU zone. The breadth was negative - more than 2:1 on the NYSE and AMEX and 6:4 on Nasdaq (Decliners vs Gainers). ISEE ratio closed at 92 indicating more puts were being traded. Tomorrow is the big jobs number - we expect around 240K+ - due to holiday hiring. We are still holding all our positions - short AEM, YHOO, DAL, IBB and long WSM, BIS, TWTR.  We went long JRJC today for a short term trade.


Good luck trading 

December 3, 2014

Stocks to Watch - 12/4/2014

Stocks to watch tomorrow: SLAB, MCHP, CARB, JCOM.

Here is the slab chart - good for short term trade:


Stock Carbonite takeover - updated

Carbonite stock -

Stock Charts Free, Charting / Predefined Stock Scans at TruCharts.com:

We really missed CARB (Carbonite) - we had an instinct that it would be a takeover candidate and today JCOM announced a takeover of Carbonite.  


Check out the JCOM chart here (amazing):

www.trucharts.com/stockview.aspx?TICK=JCOM

Stock Charts Free, Charting / Predefined Stock Scans at TruCharts.com:

Very good article : Please read 

http://www.marketwatch.com/story/hindenburg-omen-cries-bear-market-again-2014-12-03?siteid=yhoof2

Stock Market Update 12/3/2014 Close

Stock Market Update 12/3/2014 Close Updated with ISEE:

Markets closed strong again today, we still think DOW 18000 is going to happen along with a hit of the 2100 on the S&P. Up Volume on NYSE and NASDAQ was 2:1 which shows there is still strength and trend for a move higher.  Advancing issues was 2:1 (175 new highs and only 74 new lows) on NYSE and 1.6:1 (135 new highs and 86 new lows) on NASDAQ. We have the job reports on Friday and if weak - watch out for bond yields. 


Still long WSM/CYBR/QIHU and YELP.  Short AEM, IBB and DAL.

Stock Charts Free, Charting / Predefined Stock Scans at TruCharts.com:

ISEE closed today at 136 - implying markets are heading higher - this is inline with the internal dynamics of the markets which we have shown above.


Good luck trading.

Trucharts team

November 25, 2014

Trucharts.com - BUY SIGNAL FOR TGT STOCK - Stock Charts Free

Trucharts.com - BUY SIGNAL FOR TGT STOCK:

Stock Charts Free & Predefined with Stock Scans/Screener at TruCharts.com:  Check out this chart of TGT with our Fast trade Strategy and you can see the buy signal ws generated at around 60-61 and the TGT stock is now at around 72 - a 20% return if you would have used this strategy to buy the stock.

Here is the chart:


November 23, 2014

Trucharts.com – Weekly blog update and Stocks to Watch week ending 11/21/2014

Weekly Blog Update – Week ending 11/21/2014

Another week and another set of new highs in all the indices – PBOC cutting rates set off a rally in the markets Friday and the world central banks pumping heavy liquidity is driving markets higher.  The US markets are the sole investment for the world investors for the best returns. Stock markets and stocks are trending higher without a hint of any correction or pullback. We stated that the trend was higher going into the holiday season, and we expect that to continue or for the markets to be range bound.  There was a breakout in the S&P500 and the major indices this past week and even though the markets appear over bought – this can last into the New Year.  The pattern on the chart indicates higher highs are coming and there is major complacency in the markets.  But typically we do not expect to see any major issues due to the strong Q4 tendencies.  Certain sectors were sparked due to the PBOC cut – like the commodity sector, machinery sector and the emerging market ETFs.
We are seeing oil bouncing back, and we will short the airline stocks this week for a short term trade.  Gold bounced back last week but the trend is still down.  We will be watching the gold and oil sector this week. Some of the ETFs we mentioned OIL and USO are coming off lows and the energy stocks, which were hammered recently are bouncing back. Keep an eye on these oil sector stocks – NOV, NBR, DO, CVX and many others in the energy complex.
We are long WSM, CYBR, YELP and short AEM, IBB and waiting to short the airlines sector this week.  This will be a short trading week but expect consolidation and range bound markets.  Here are some charts to ponder over this week. You can see clearly the UPRO (long SP500 ETF) is very overbought and the DAL chart is breaking down.
Charts for the week:


November 21, 2014

Stock Buy/Sell Strategy Signals at TruCharts.com

Stock Charts Free and Stock Scans at TruCharts.com: Stock Buy/Sell Strategy Signals:

Here is the report from our trade strategy sorted by volume.  These are stocks that generated a buy signal yesterday from one our fast trading strategies - check the open on all these stocks today and you will see all of them opened positive and you could have made money in these stocks.


November 19, 2014

Trucharts.com midday update Stock Markets

Trucharts.com midday update Stock Markets


We stated that the markets will be meandering within a range here.  We saw a breakout yesterday and we need to see follow through.  FOMC minutes were released today and that is affecting the markets.  See article below.

Best Stock Charts and Scans - TruCharts.com -

Our AEM short is still looking good.  We are long YELP - but we had written covered calls on that position - it is down - but we will hold till December.  Still short IBB and biotech.

Looking to short LUV and airline stocks.


Our pick Z and TRLA from the weekend blog did well these past two days - check the charts on our site.

www.trucharts.com/stockview.aspx?TICK=Z

www.trucharts.com/stockview.aspx?TICK=TRLA

Also check out the FOMC minutes brief at:

http://www.zerohedge.com/news/2014-11-19/fomc-minutes-show-deflation-wary-fed-not-worried-about-global-growth


TruCHARTS team

November 16, 2014

Trucharts.com Stocks to Watch and Markets Blog Update Week ending 11/14/2014

Trucharts.com Markets Blog Update Week ending 11/14/2014

Markets have been vacillating and staying within a very tight range and always moving higher into the close. The VIX gets slammed at the end of the day and the markets bounce back – even though we are seeing narrow breadth and narrow leadership in the stocks driving the markets. We have ramped very fast from the correction in October and the markets appear to be topping out here. Individual stocks have been seeing some movement – but no sector other than the transports stands out. There is no question that this is definitely a trader’s dream come true – stocks move quite nicely and smart traders (day traders and short term traders) are taking advantage of this volatility in the stocks. Take a look at the stocks like Z, AMZN, BIDU, TSLA and many more momo stocks.
Our sentiment indicators are showing that the markets will stay within a tight range and, as we stated in our earlier blogs, markets will not correct into the Thanksgiving holidays. We can expect volatility but no major moves (unless there are black swan events). The GOP is going to take some time off from their victory in the mid-term elections and come back with a fresh agenda in January and let the President take it easy for the holidays.
The move in gold this Friday looks like a BULL trap – be mindful – the trend is still down and the move in the gold miners also was not on convincing volume. We would sell into the gold rally – the move was due to the coming referendum in Switzerland for the repatriation of their gold. We do not expect this to pass, and the day the this does not pass – watch gold – we think it will drop over $100 (just our speculation). We are short AEM and will stay short. Our prediction for gold price is still at least $1000.
Our IBB short is still in play and we expect the BIOTECH unwinding to start – it started on Friday. Mutual Funds will start to take profits in this sector and will try to show good performance into the end of the year.
The China stock market is coming off a bottom and since the link with the Hong Kong stock exchange, the China ADRs have been moving up quite well.  Surprisingly, we missed BIDU but we have been long JRJC (www.trucharts.com/stockview.aspx?TICK=JRJC) and are looking for stocks in the China ADRs for good buy candidates – we like WUBA – here is the chart – check the weekly and daily chart – (www.trucharts.com/stockview.aspx?TICK=WUBA). Check the weekly technicals:
Here is the chart for reference:
WUBA Stock Chart
We have a special offer for the holidays on our yearly subscription – 50% discount – check this at the following link:
The following is the list of stocks we will be watching this week:
Z                    - www.trucharts.com/stockview.aspx?TICK=Z
TRLA              - www.trucharts.com/stockview.aspx?TICK=TRLA
CYBR, WIFI, TWTR.
We are long CYBR. We closed our USO position at a loss - we were stopped out of the position. Always remember capital preservation is key.
Here is the Help file image for our real time news page:
Stock Market Real time News - Trucharts.com
Trucharts.com Realtime News Help

November 14, 2014

Trucharts.com Buy Strategy signal for AMZN

Trucharts.com AMZN stock update:


Stock Charts - Predefined Stock Scans - Trucharts.com - AMZN stock update: (Stock Trading Strategy); StockScreener.

Check here below our buy/sell strategy for AMZN - we had a buy signal around 305 and today the stock is up to 327 a move of over 5% in less than 4 days - this strategy is available for free at our site for registered subscribers.


AMZN Stock Chart
AMZN Stock Chart with BUY signal

November 12, 2014

Trucharts.com positions update

Our position calls on YHOO are still doing well. We had picked YHOO at 38. We bought YELP this morning when it dropped at around 60.6 - position is down now - we will watch this closely - technicals are still positive MACD and RSI.  

Check the chart at:  www.trucharts.com/stockview.aspx?TICK=YELP

We are still long T, USO, JRJC and short AEM, IBB and looking to short LUV and GM.

Trucharts Team

November 11, 2014

Stocks for Trading tomorrow 11/12/2014

YELP, LVS, WYNN:  Here is chart for YELP.  Check the MACD and RSI moving up.


Trucharts Invitation

Trucharts.com 


We invite all to check out and use the site and susbcribe for free. There are so many features to help you to learn to start investing in stocks and make sound investment decisions. Check it out and start with some basic charts - and start a virtual portfolio on our site and monitor your progress. Portfolio is accessible after you sign up.

Also check our special subscription offer for the holiday season.

You can find many excellent technical analysis tutorials at this page: 

http://finance.yahoo.com/video/playlist/talking-numbers/;_ylt=AwrSbD6xd2JUcGsA.k1XNyoA

Trucharts.com Auto Buy Sell Strategies


Our Auto buy / sell strategies are something no one else offers on their website.  We invite you to check this feature out on our stockview page at: www.trucharts.com/stockview.aspx 

and here is the help file that shows how to access this feature:


Trucharts.com Stocks to watch list 11/11/2014

Trucharts.com Markets and Stocks to Watch List


Markets appear extended here - we expect consolidation and small moves to new highs. With the upcoming holiday season, we expect markets to stay within a range of new highs and consolidate into the New Year.

Watch these stocks today:

DHI - reported earnings miss today
ZNGA
BABA
VIPS - earnings this week
BITA - earnings this week
TWC
AMZN - moving higher - chart at:AMZN Chart

Check our earnings calendar at:

http://www.trucharts.com/EarningsView.aspx

Trucharts team


November 10, 2014

Trucharts.com - Stockwatch List

Turcharts.com - Stocks to Watch List


Here is our list of stocks to watch for this week:

NSC    - Up today $3 - our buy signal triggered on Friday and shown in our blog
ABBV  - Up today $2
XOP    - down - but we think consolidating
T        - moving higher
MO     - hitting new highs
JRJC   - China allowing foreign investors access to China markets
USO    - Consolidating - watching closely to see breakdown or move up
WSM   - Watch closely - earnings expected 11/19

Trucharts Team

November 9, 2014

Trucharts.com - Stocks to watch week of 11/10 and Blog Update week ending 11/7/2014

Trucharts.com - Blog and markets Update for week ending 11/7/2014

Mid-term elections done - well the GOP won and now we have to see their agenda. Employment news - which was so-so and with that we had, oil rallying after being trounced, gold rallying on Friday after hitting new lows and the gold miners rising.  Markets hitting new highs and VIX dropping (as we had been indicating for quite some time) - we still expect the VIX to drop and markets to consolidate their gains here and breadth is narrow. Markets are heading into a strong cycle - end of the year when holiday season starts and into the new year.  We do expect to see some pullback from this big move, but move to new highs is still in the cards. With the Fed staying put on interest rates, we do not expect any type of major pullback in the markets. The Fed will not raise rates till next year - and that will drive the markets' direction. With no other avenues to make good returns, investors have no choice but to put the money into markets and now the BOJ announced a round of stimulus to put money into stocks - that just gives the markets more impetus to move higher.  Pockets of strength still exits and we need to take advantage of these.
We are looking to the following sectors and stocks next week. Oil and energy stocks/ETFs, gold miners for short term trades.
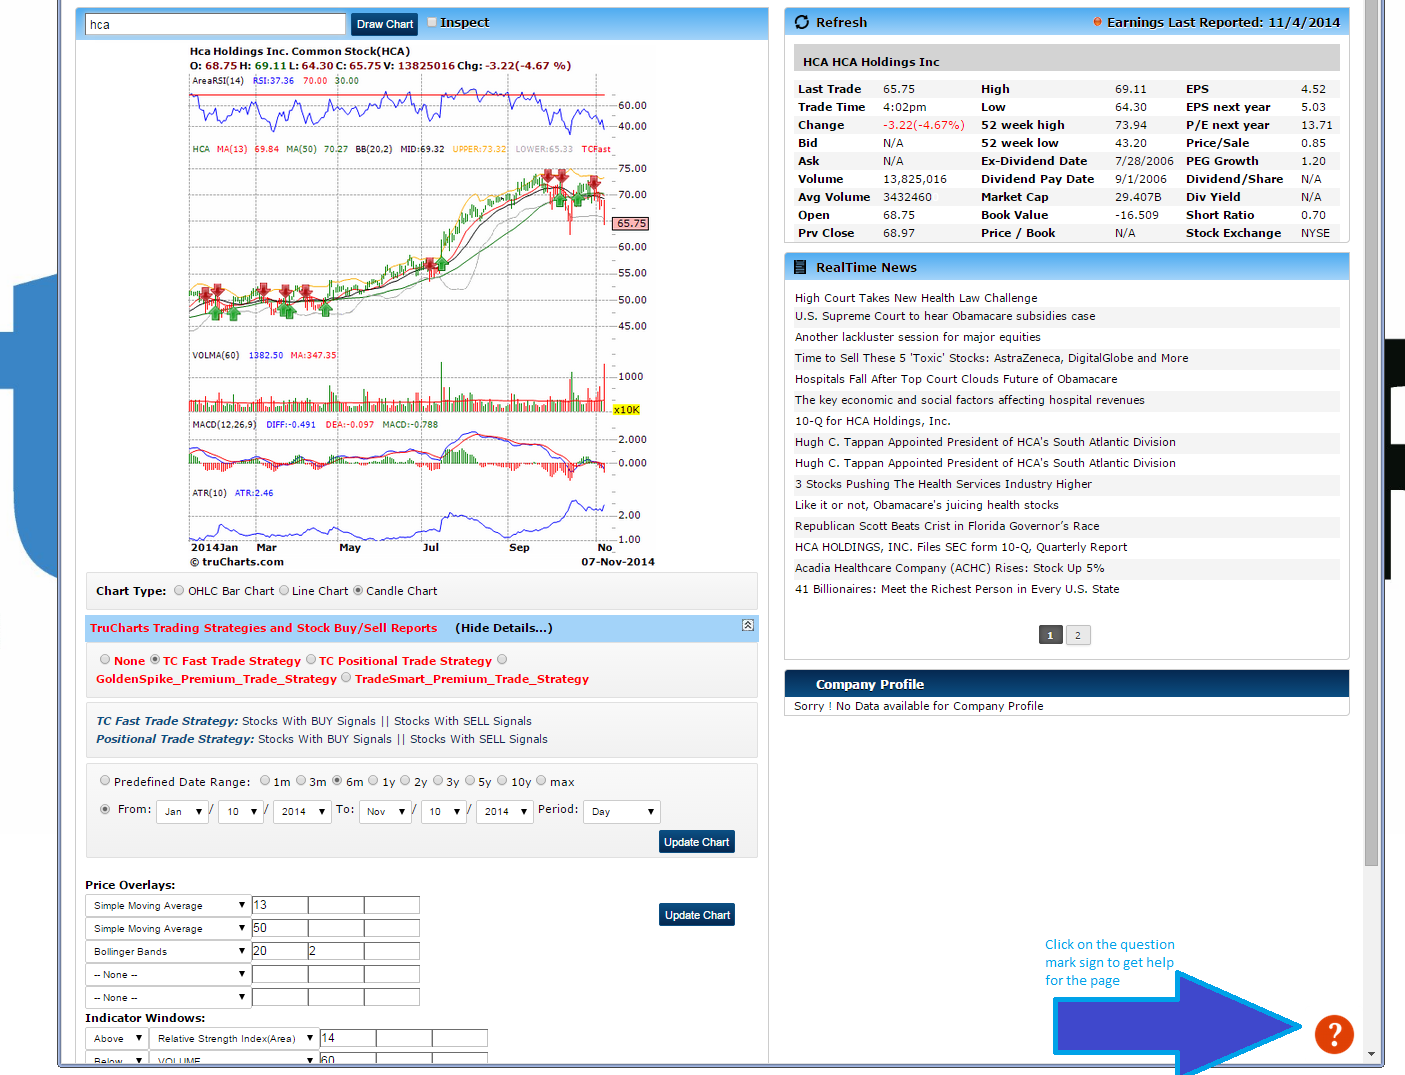
We have added a very helpful feature on our site to help and assist our users on how to use each page and a description of each field on the page. Please check this image below for this feature - it is on each page of our site now (except home page which is under re-design).
help_photo
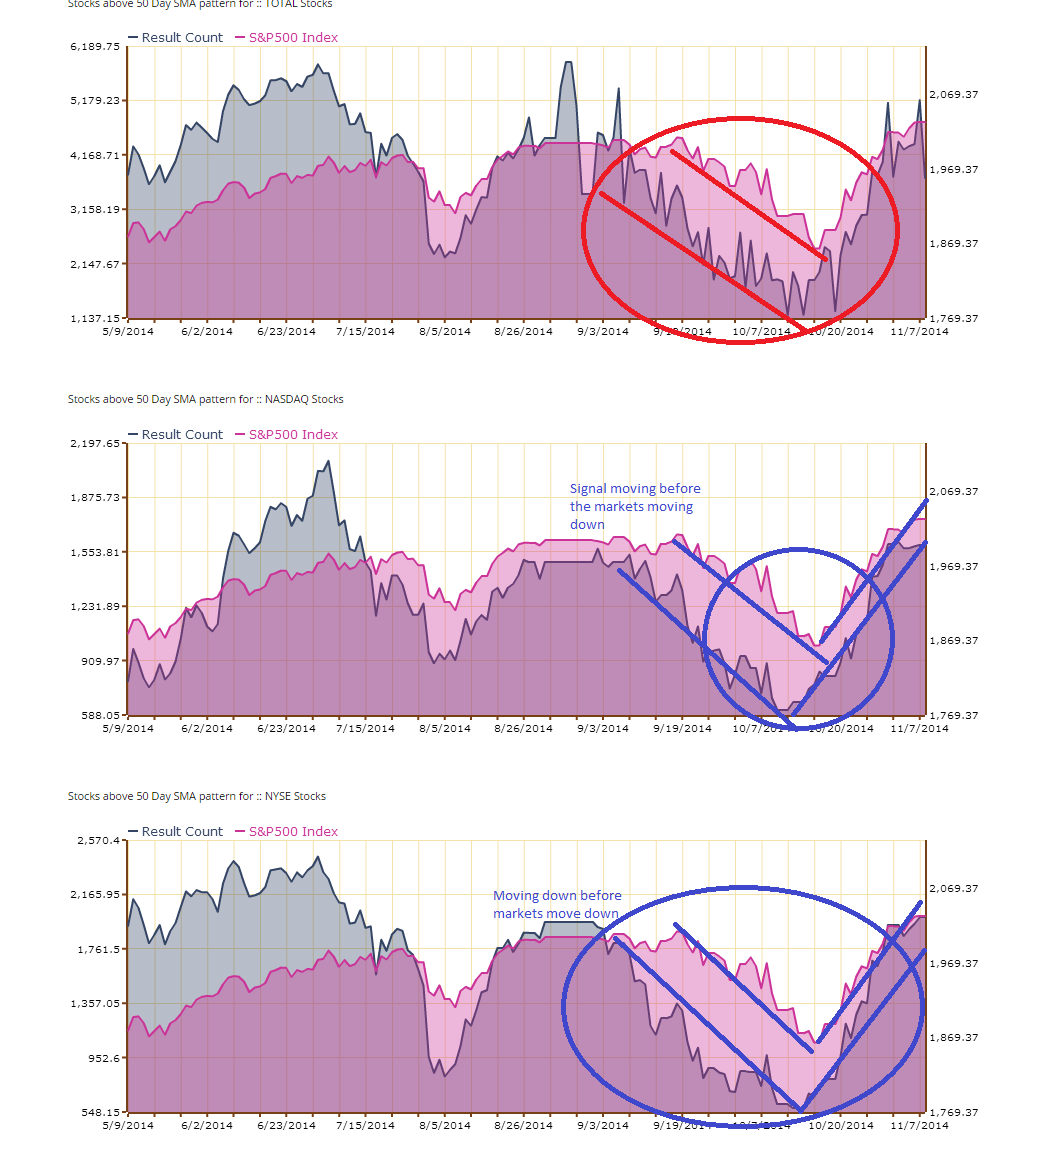
Here we wanted to show below how the sentiment charts from our site predicted this massive move up and the correction we experienced 3-4 weeks ago in the markets - note the drop in the stocks above 50d SMA before the markets actually went down and then the rise in stocks above 50d SMA before the move up in the markets. The signals are very clear prior to the market moves - we have highlighted these with the trend lines. You can see clearly that we are at a top and a sideways market for the next few weeks and possible pullback prior to thanksgiving.  As you can see the stocks above 50d SMA is moving down and we are in a topping mode for the markets. We have several such indicators for all the reports we generate on our reports page:
Sentiment Signal prior to market moves
Here is our list of stocks to watch for the coming week:
Buy SIgnal: www.trucharts.com/stockview.aspx?TICK=XOP
www.trucharts.com/stockview.aspx?TICK=NSC
www.trucharts.com/stockview.aspx?TICK=TGT 
www.trucharts.com/stockview.aspx?TICK=DO (watch)
www.trucharts.com/stockview.aspx?TICK=ETP
www.trucharts.com/stockview.aspx?TICK=CNQ (short term trade)
Good luck trading.
Here is the udpate from our hedge fund manager for his performance from last week (cumulative return for a $50000 account):


November 7, 2014

Trucharts Special Subscription and Stocks to Watch Update


Stock Charts Free - Our subscription offer to our site is normally $180 for 1 year and we are offering it at $90 for one year a 50% discount.  12 MONTHS (FLAT 50% OFF).  This is the best deal you will see and learn how to make money using our blogs, and the site trading strategies.  We have users joining us and moving away from other sites.  This is a Special Holiday offer.

Stocks we picked yesterday: RRC, USO, TIF, BABA are all up today.  

Our AEM short is not an issue since we sold the put and we think the gold jump is a dead cat bounce for the short term.  Long term trend is still down.

Trucharts team

November 4, 2014

Trucharts - Stocks to watch - BUY/SELL Signal strategy


AEM short still in our favor. Gold is down. 

Here is a chart for DAL BUY/SELL signals using our TC fast trade strategy - based on this chart you would be up over 15% within 10 days.