Go Daddy Signup

Showing posts with label USO. Show all posts

December 21, 2014

TruCharts.com – Free Stock Charts – Blog week ending 12/19/2014

Trucharts.com Blog week ending 12/19/2014

For SEO: Trucharts.com – Stock Charts Free, Stock Market, Stocks, Charting, Dividend Stocks, World Markets, Technical Analysis, Market Sentiment Charts
Merry Xmas and happy holidays to all. We are in a short week of trading this week and the fireworks were on last week after Fed Speak. We did not expect any surprises from the Fed on the raising of the Fed Funds rate, and the Fed made it a point to tell the markets that it was still ok to take risks and that drove the markets to recover over a 800 points on the DOW and 100 points on the SP500. A lot of this was driven by energy stocks and since some of the stocks had dropped over 50% – there were short covering rallies and bottom fishing and a major short squeeze. BofA Merrill Lynch downgraded several semi stocks but these did not correct as much. The SP500 and DOW look like they are still in an uptrend and our indicators are still showing a trend for the markets to mover higher – after a short consolidation period. The move this past week was massive, but the volumes in some stocks was not high. 
We like XLU (www.trucharts.com/stockview.aspx?TICK=XLU) and the utility stocks as good dividend earners. Check out the charts for SO, ED, PCG and DUK. Even the REIT’s look good and some consumer staple stocks look good. We took a position in K or Kellog (www.trucharts.com/stockview.aspx?TICK=K) and USO – we believe this has finally bottomed for the short term. Keep an eye on CAT (www.trucharts.com/stockview.aspx?TICK=CAT) – we are looking to take a position in CAT. 
We have been hurt by our short position in IBB – but have been writing puts to improve our short price. Our other positions are doing OK – Long WSM, short YHOO (plan to close Monday), DAL, AEM. We are looking to go long CYBR.
There is definitely a XMAS rally going on and we expect this to last into the New Year – until the earnings season starts. AAPL (www.trucharts.com/stockview.aspx?TICK=AAPL) still looks good technically.
We added some new features to our site this week – execiting stuff:
1. MULTIPLE SYMBOL CHARTS on one page – check this feature out at: http://www.trucharts.com/multiplestockcharts.aspx
2. ICHIMOKU cloud indicator on our stockview page and turtle trade indicator
3. Added borders to our charts
Check the features out and also our page: http://truchartscom.blogspot.com/p/why-is-trucharts.html
In addition, we want everyone to take advantage of avoiding monthly recurring fees  and sign up NOW for one very low annual membership for full access for just $90/year – a 50% discount to the annual membership fees and this gives you real time categorized news and complete access to all of the site including dividend stocks etc.
Again – Best wishes for the holidays to all and a Happy New Year and good luck trading.

TruCharts Team

December 11, 2014

Trucharts.com Markets update 12/11


Free Stock Charts/Scans/Stock Screener at Trucharts.com: 12/11


Well we had huge ramp this morning - we suspect this was huge short squeeze which led to short covering. The trend is still to the 50d SMA. Oil crashed and gold pulled back. RH stock earnings drove up the retailiers and their forecast was positive. So WSM (we are long) moved up and our shorts are still holding. There was pullback towards the end of the day and the ISEE closed at 54 - one of the lowest readings in the longest time. Watch the 50d SMA for SPY. Markets are trading very technically. Fundamentals are just an excuse now. Bubbles are made of volatility, no fundamentals and lot of big moves in the markets while bears and bulls try to fight it out. We think oil should stabilize in the 55-60 range. Still holding all our positions. We hope there is now a revolt against the airlines for baggage fees - now that oil is down - they should no longer be charging these fees.


Chart for RH at:

www.trucharts.com/stockview.aspx?TICK=RH

Trucharts team

November 3, 2014

trucharts.com - Markets update

Trucharts.com - Market Update


Markets are consolidating and there is profit taking after this huge run up.  We think the funds will try to cash in before the holiday season to keep up their performance numbers. Also the election is creating some uncertainty.  We are short GLD and AEM.  Long AAPL, LNKD and we may close USO it seems to be breaking down.

Trucharts team

November 2, 2014

Trucharts - Stocks to Watch - Blog Update for week ending 10/31/2014 

Another week and another major move up from such an oversold correction we had two weeks ago - now hardly anyone remembers that correction.  Not only did we recover all the losses in the pullback - the markets closed at a new high.  That is what markets do when the Fed is on their side - low rates are here to stay and markets around the world are not performing as well as the US markets.  We think there is a huge inflow from investors and funds outside of the US that are driving the markets higher. First we had a big spike in volatility during the correction, we stated that the markets will move higher and the VIX would pullback - that is exactly what we saw - in addition, Bullard spoke and then the Bank of Japan announced a round of QE to weaken the yen and bingo - Friday the markets jumped.  Japan debt to GDP ratio is over 200 but no one cares - commodities are getting crushed - along with Gold - we were wrong on our call on gold.  In one of our blogs a few weeks back we stated that gold had broken a critical trendline and sure enough we see the follow through.  We expect gold to reach $1000 now.  We shorted AEM as we stated in our updates this week.
We expect markets to consolidate and move higher with weaker technical backdrop.  We are heading into a strong period in the year for markets and into Q1 of 2015 - we do not expect any major surprises - unless there are wars and major breakdowns in the Euro zone.  The Fed has basically stopped QE but with low interest rates - they are forcing people to take risks.  Individual stocks are moving in the range of several $$ per day -  just look at the biotech stocks - these are a day traders' dream come true.  Along with this we have the internet stocks like LNKD, BIDU etc.  There are other stocks in other industries that are moving several $$ a day.  Reminds you of the 1999-2000 era.  Unbelievable..  Well take advantage of this and make hay while the sun shines - we do not expect any interest rate hikes from the Fed till middle of next year - so be happy and make money trading.
From a stocks to watch next week - here are some of our top picks this week are - AAPL, LNKD, MA and short AEM/GM at 32+.  We will go long MA and LNKD this week.  Here are the weekly charts:

We closed TUBE and GM short this past week and are still long T/USO and AAPL.  We are still short BIOTECH sector.
Here is a good lesson on technical analysis - this one is about Trend Channels:
http://finance.yahoo.com/blogs/talking-numbers/learn-trend-channels-211350606.html
We will publish an interesting sentiment indicator from our site which predicted the correction and move up these past two weeks.
Best of luck trading this week.
Trucharts team 


October 31, 2014

Stocks to watch Update

Stock to watch Update and Hot Stocks


AEM was down this morning (we shorted yesterday) - Gold down $30+ today.
AAPL up, BIDU up, V up and MA holding here. 


Markets are moving higher - here comes the end of year bubble.


We plan to short GM at 32+.

Hot stocks today: GRPO, KLAC - watch these closely and V for move higher.

Trucharts Team

October 29, 2014

Stocks to watch for 10/30/2014

Stocks to watch: 10/29/2014


Stocks to watch: 10/29/2014

Watch these stocks today - BIDU, V, MA, FFIV, STX, CRUS - all reported earnings after hours today - V jumped and looks tradeable (announced a $5B buyback). 

We published the article on the Fed announcement - QE is over - thank God.  Now we get to the interest rate rise.  What a massive bubble the Fed has created and the world banks along with it.  

Gold dropped and USO bounced today - we will be shorting AEM (Agnico Eagles Mines) tomorrow in anticipation that gold is definitely headed lower.

Closed TUBE position today with very high reluctance to sell this position.  We made money so we are happy.

Trucharts.com team

October 27, 2014

Trucharts.com - Markets Update - 10/27


We had indicated that markets will move higher this week and the markets were flat today.  Oil is still heading down - and the energy stocks are getting crushed - just look at some of the offshore drillers and equipment suppliers - HAL. NOV, DO, SDRL, RIG (www.trucharts.com/stockview.aspx?TICK=RIG) - just getting totally hammered.  This does not bode well - even though we think oil complex is getting extremely oversold - we wrote covered call on our USO position today.  Gold was down today - that is not a good sign for the commodity complex and the miners which have been hammered to almost ridiculous valuations.

TWTR, BWLD and AMGN reported earnings after hours.  TWTR was down almost 10% in after hours trading.  Cannot generate enough users and offered in line estimates.  BWLD and AMGN reported positive earnings - we will see how these will react tomorrow.  We had picked BWLD in our weekend blog.

Additionally we had indicated to keep on stock Alibaba - symbol BABA (www.trucharts.com/stockview.aspx?TICK=BABA) - that was up today.

We like CYBR - closed strong today - we expect that to go higher tomorrow.

We will keep an eye on VIX and the Biotech sector - a very crowded trade and now everyone is jumping on the bandwagon of the biotech sector.  


Our positions are still holding long AAPL, T and watching BABA. Expect some consolidation next week - due to heavy earnings calendar next week. Our short on GM is still looking good. 

Many biotech earnings are coming out this week.  We will have to watch these closely - the biotech stocks are very extended technically.  

Good luck trading..

trucharts team

October 19, 2014

Trucharts.com end of weekly blog update - 10/17/2014

Trucharts.com end of week Blog update 10/17/2014

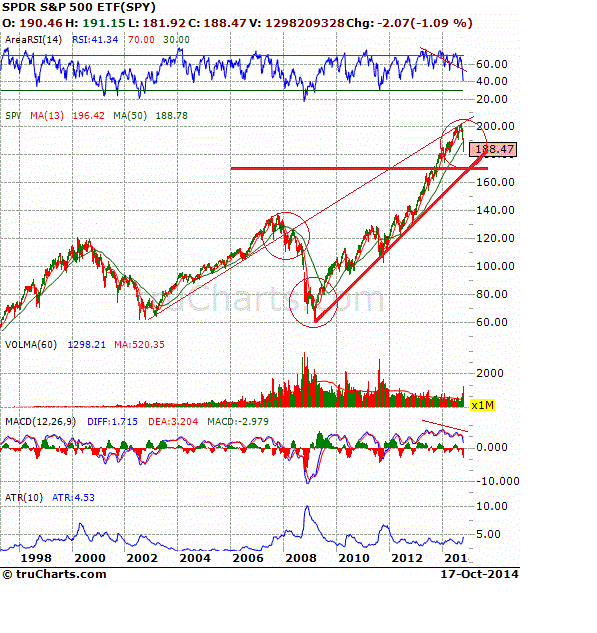
What a week of market gyrations.  It had our head spinning.  We were expecting volatility – but this was nothing we have experienced in the past two years – since the markets (like we stated before) have been going up in a straight line.  The correlation between the Fed balance sheet and the markets has been moving in tandem.  And then the Fed speaks anytime the markets drop – because obviously all the Wall Street guys are concerned about their portfolios dropping and how this will impact the average investor.  Fed governor Bullard spoke and then we had some other Fed governors speak – as soon as that happened the markets jumped and bounced.  It is like a scripted movie – predictable. Bullard (non-voting member fo FOMC) stated that the Fed should keep the bond buying active – wow!! As if the Fed balance sheet is not big enough yet.  It is $4T – yes 4 TRILLION and that has created a bubble in stocks, real estate and every asset.  Bonds had moved higher into this volatility and the VIX spiked to a high of 31+ and then settled the week at 21.99. We expect the VIX to pull back and bring some sense to back for some time into the markets.  There are some interesting charts we have shown below and with comments and trendlines indicated.  We are short IBB still and GM.  We expect NFLX to pull back and since we have earnings coming up from AAPL and many big names next week – we would like to stay on the sidelines and keep our powder dry.  We went long USO even though we think the correction in the OIL/energy sector is not over.  Gold did bounce but the long term chart looks weak.  Gold miners are getting slaughtered.
We have added one of our unique sentiment indicator charts at link:  http://www.trucharts.com/MarketSentiment_ISEE.aspx
This is of VIX vs SPY500 and you can see clearly how the VIX spiked significantly last week.
We have added the charts for LUV (Southwest airlines) – position closed last week.  DAL short closed last week – even though we may retake the short positions in these later.  Our SNDK profit was 150% – Oct 92.5 puts – we bought at $4 and it closed and sold for $10 on Friday expiration.
XLE chart shows breakdown in the energy sector.
QQQ bounced exactly off the 50 week average – see chart below.
The volatility did allow day traders to take advantage of the daily moves in the markets/stocks.  One of our fund manager friend who manages a S&P futures fund made the highest return and the return for the week was a whopping 17% and the YTD  return has been 64% with a hit ratio of 96.5%.
If you are interested in discussing this with our hedge fund manager – please contact us at support@trucharts.com and or at bbhatia@trucharts.com.  Please keep in mind that the minimum investment required is $50K or $100K.  
Here is the weekly return chart for past 32 weeks.  As you can see the return is low when volatility is low – but none the less positive.


Best of luck trading next week;
Trucharts team

October 17, 2014

Trucharts.com - Stock Charts - Market Rally - ALL Indices up

Trucharts.com - Blog Update - 10/17/2014 AM

Yesterday at the end of day we said the VIX was extended and we expected some type of rebound - in addition to the markets being oversold. We were expecting this and that is what we are seeing today. Excellent day for traders to make money. We were long USO and TUBE into this rally. The Fed and ECB are the key focus and Fed liquidity is what is driving these markets.  We would sell into these rallies and take profits.  We expect this to last into next week since many major earnings will be out from many bgi names next week.  Keep your powder dry and if you are a great trader you can make some money here.
Watch XLNX and the oil sector for a bounce (oil sector was very oversold).  Watch for a pullback in the VIX.

Trucharts team

September 3, 2014

truCharts.com; Stock Charts update 9/3/2014

Stock Charts - truCharts.com - Update 9/3/2014


The DJIA and the SPY are moving within a very tight range for the last few days since the close above 2000.  There may still be legs in this rally, but we advise taking profits in at least half of your positions and watch oil closely today - coming off an oversold condition - check USO and OIL - we still like these from a technical analysis point of view.  BIOTECH rally is running out of steam here - very overpriced sector and over hyped.  We will go long USO (full disclosure) end of day today and are long TUBE, BIS and YHOO.  We will publish a technical update on the indices this week and show some technical divergences.

TruCharts team
www.trucharts.com