Go Daddy Signup

September 25, 2015

IBB short update?? Read it..


We are providing an update on our position on IBB. It is slated to close below 50d SMA for the 1st time in over 18 months. We would short it here - we are short since 340. See RSI and MACD - trending down - this is weekly chart.

Here is the chart:


September 13, 2015

Weekly Blog - Fed Decision on rates this week - What to expect and Market Action - What to buy/sell?

Fed Decision on rates this week - What to expect and Market Action


The Fed week is finally upon us. What is the Fed going to do - the grind and the news is unstoppable - it is discussed on every financial channel and news and now we have the heads of financial institutions and governments asking the Fed not to raise rates - really, now we need these knee jerk morons who have made a killing in the markets because of bubbles from the Fed's own making and decisions, to ask the Fed not to raise rates. I have never seen moments such as the ones we are seeing now or ever, since I started trading the markets over 20 years ago. This is unprecedented in its nature and irresponsible with even the IMF and EU asking the Fed publicly not to raise rates. Well, with over 5.5M job openings, the lowest rate of labor participation, unemployment rate at 5.1%, and Fed balance sheet at $4T - bubbles in stock markets, real estate - these morons want the Fed not to raise rates!! We think the Fed is in a corner (as we said before) and is scared to even budge on rates. The incessant speculation from the CNBS'ers (on purpose) and the non-stop blabber on Bloomberg is really annoying and frustrating - not a single person really knows what is going to happen - OK, we are going to say rates are not going up this week and the Fed will keep the same language - we may be wrong, but, at least we are not going to be blabbering all day about it. Expect volatility around the bonds, US dollar and gold when the Fed decision is announced.

Ok, let us get to the markets now - what do we expect to happen this week - Markets were up on Friday - as we said the markets have never been down on any 9/11 after the event. We expected that and were prepared for it. We are balanced in our portfolio short and long. We are short some semi stocks and overvalued companies and expect these to still move lower - we closed our AMBA short for a nice tidy profit. We were short AMBA from $115. We still think the stock is headed lower. We closed part of our short in MU, GPRO and shorted FIT.

We are long NFLX and BIDU,CYBR,MBLY. We know these are not exactly what we would like in our portfolio at this juncture - but we hedge these with options. The VIX is still trending down and based on our analysis this week from the markets and stocks on Friday, we expect the markets to head higher into the Fed decision day - very likely it will be volatile due to uncertainty from the Fed. 

Do not forget - this is options expiration week and end of quarter for Calendar Q4 and we will be heading into earnings season for Q3 and expect a bunch of surprises and warnings. We saw several charts that look like good trades heading into the Fed rate decision day on Thursday. Charts that look good on charts are shown here (as much as we hate biotech sector - it did not close below our 50week SMA and is tredning higher for the short term - we are short IBB and will likely have to roll that position out into the Oct expiration). Stocks that are looking good for trading are - AAPL,DIS,MCD,CAH,RH,ILMN,GILD and some other biotech stocks. You can check this report on our Market Reports page - here are the links (you can skim the charts quickly with our mouse-over chart feature):

1. Stocks with Buy signals
2. Stocks which close $2 or higher

Here are some of the charts we like for trading this coming week - 


Good luck trading.

Trucharts Team/Founder/CEO

September 6, 2015

Markets - Up and Down - What to do now - BUY or SELL?

Markets - Up and Down - What to do now - BUY or SELL?


Happy Labor day to all.

Well what do we think of the markets here and the direction. We stated in several blogs that markets were exhibiting topping action and we told our readers to take profits, sell rallies and reduce exposure or go short the semiconductor and biotech sector. We have been following this advice in our own portfolio. We have been net short since late June.

Markets have been bouncing from the recent crash and everyone was getting excited. This tells us that the people are still not scared enough and the folks on CNBS (got this of the web and I love it) are still very bullish in light of the market action. The VIX is still elevated and the ISEE call put ratio is still biased towards more put buying - we have not seen such a long string of the ISEE C/P ratio trend towards put buying. Markets dropped on Friday heading into the Labor day weekend. 

Major ETFs reflecting the DOW (ETF: DIA) and others have closed below their respective 100 week SMA. This is definitely not a good sign. We think the markets are headed lower to the 200d weekly SMA and maybe to the next support of 15000 for the DOW. We still recommend lightning up on your positions and take profits in any rally. Companies earnings forecasts are not strong and many are even lower than consensus forecasts. Just take a look at DE. JOY and the semi companies. Stocks are driven by earnings and stocks with their downward movements are indicating lower earnings coming in the future. Corporate buybacks and earnings number rigging along with Fed liquidity was what was driving the markets. You can expect short term rallies due to oversold conditions - but the trend is still down and we would wait before going net long. Insiders have been selling stocks at a rapid pace and they were doing so when the markets were topping - Major insiders in the biotech sector and semi sector dumped a lot of stock at the peak - this tells us that they got extremely rich and do not anticipate any higher prices - the markets were priced to perfection and the markets had gone up without even a 10% correction for over 3 years. We have shown some of charts below.

This past weekend the finance minister for China said that the China stock bubble had burst and this tells us that the Chinese government reactions and intervention in their stock markets is not working - and guess what happens - the Chinese citizens promptly move their money into real estate - the cycle never ends. We will have to wait and see how all the events play out in China. 

China is definitely slowing down and this is the world's second largest economy. They are mired in over capacity and nit driven by internal consumption. We think this is impacting the world economy and the commodity complex as China is the biggest consumer of the commodities.

Housing prices are again up in the US and heading into another bubble and we think this is definitely in the back of the Fed's thought process and with unemployment hitting the 5.1% well within the target range of full employment for the Fed - we think there is going to be pressure on the Fed to raise the Fed Funds rate. We have now the highest rate of employment participation (that means majority of the employable folks have stopped looking for a job).

From a stock perspective - we would not go long any of the semi stocks - we like SLAB possibly - but be mindful - you can take a position if you do not mind averaging down. We would hedge all our positions by selling covered calls and or you can sell puts if you want to own a stock. Now for shorts (be mindful we do not recommend shorting for amateurs - this is for experienced folks) - we still think IBB offers the best shorting opportunity here along with AMBA stock. We are short IBB and AMBA (since 115). Even though some of the indicators are oversold on a daily basis, the weekly indicators are not oversold yet.

We recommend watching this documentary (on youtube) on how OIL controls the world and how the "SEVEN SISTERS" control the world's oil: https://www.youtube.com/watch?v=XtYOjMmEMeg - it is called the 'Secret of SEVEN SISTERS' - unbelievable. 

Check out our buy/sell strategies automated on your portfolio to see if your stock is still a buy or sell signal - try this on weekly and daily chart. Use the Stock charts page to check this. 

As we said last week - we are self funded and would like to get more subscribers so we can look for an investor to help us take the site to the next level - we would like to ask our readers and users to subscribe - it is a measly $9 or $15 per month to get the best feature set on the web and we know this since our returning user base is engaged on our site for more than 12 minutes a session. We use very minimal budget for marketing - we use our funds primarily for development, paying salaries to our developers, and servers, news/data feeds. 

Here is the link to the subscription service page: http://www.trucharts.com/truCharts_Services.aspx 

Here are the weekly charts along with our trendlines drawn:


Good luck trading.

Trucharts team/Founder/CEO

September 3, 2015

Why bubbles exist and monetary policy is still easy!!

Why Bubbles exist and monetary policy:


Read this and see why we have bubbles everywhere - one day the fat lady will sing and (it happened in 2008), and the chicken will come home to roost. Thanks to the stupid Fed (Greenspan, Yellen and Bernanke) are all to blame and the US government was towing the line with Fannie And Freddie Mac which went bankrupt.. Unbelievable and now we are in another stock and real estate bubble in USA and many countries around the world due to the easy monetary policies.

http://www.businessinsider.com/worldwide-monetary-policy-in-one-chart-2015-9


Also watch this video - unbelievable - http://www.youtube.com/watch?v=JYTyluv4Gws

From a trading perspective - we are still net short and our AMBA short worked very well, along with IBB short - we like this trade - long AMGN, short IBB. We are short tech stocks still - PYPL,INTC,SWKS.

Trucharts team

August 30, 2015

Fed Speak - What to do with your portfolio this week and market direction - UP or DOWN!

Fed Speak - What to do with your portfolio this week and market direction - UP or DOWN!


We just went through one of the most volatile weeks in the markets since the dog days of 2008-2009 financial crisis. Is China slowing, what is the Fed going to do and is the world headed into a recession? So many questions and the answers are not very clear. From a volatility perspective, the VIX hit the highest levels on Monday last week when the DOW traversed over 4500 points - this has never happened before - there were huge opportunities to buy at the lows that day and make a huge profit - volatility is truly a trader's gift and an easy way to generate some very quick profits - if you are a technical trader it becomes even easier. You have to make your preferred stock list and watch those only else you will not be able to choose during big market moves, like the one we had last Monday 8/24. We did make money as we were net short into the market and would have really preferred to get into some stocks that tanked at the open - we knew that the  markets would bounce - since it was an oversold condition and markets did rebound into the end of the week - just go check some of the low prices for some of the top stocks on 8/24. Several stocks opened down over 20% and then recovered very nicely. That is why you have to have cash set aside for trading on volatile days - because the returns can be magnificent. 

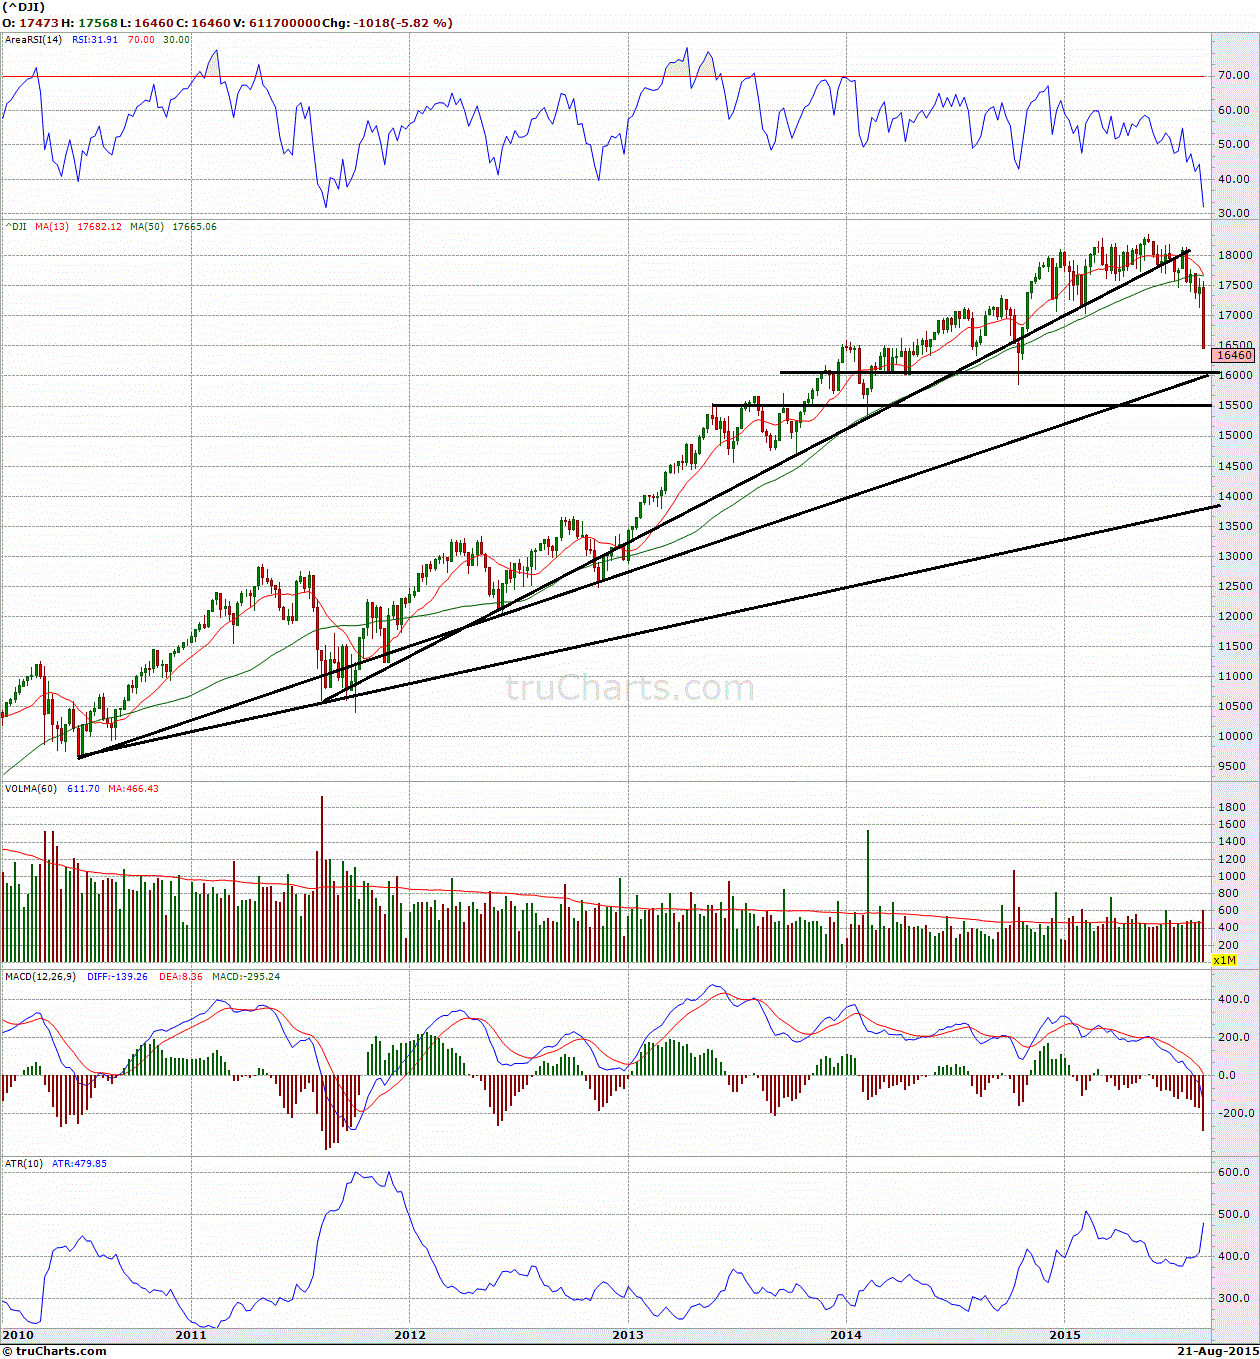
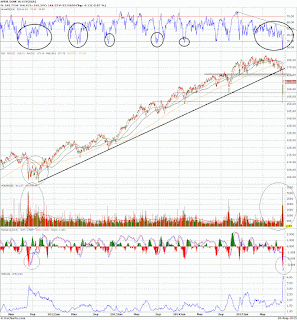
Markets rebounded over 1000 points on the DOW late into the week and many stocks bounced off the lows - there was short covering and some buying buy the big funds since they saw this as a huge buying opportunity - we saw the fund managers discussing this on TV. Volatility numbers are still high and we would expect volatility this week also. Major trend-lines have been broken and we have to test the trend-lines and the previous support levels (which are now resistance levels) for all the indices.

Fundamentally we do not think the economy or the tech stocks have bottomed - China slowdown and the issues/headwinds they are facing from their bad loans, high debts, exports slowing, over capacity are going to have repercussions around the world. US economy is still strong with the jobs numbers still ahead of the 200K/month magic mark and we think the Fed sees this and is ready to pull the trigger in September. We still suspect whether the Fed will actually raise the Fed Funds rate in Sept. We wil have to wait and see - from our perspective we do not think they have the 'guts' to do it. 

China intervention into their stock markets was one of the worst ideas and then they have been so reactive to every little piece of economic news, that they are acting like a 2 year old's in a candy shop. Lowering RR ratios, cutting interest rates, injecting cash, and so many others drastic measures, it makes one wonder what really is going on in China. 
Is it really that bad!!

There was The Jackson Hole meeting this weekend and the Fischer indicated that the Fed would move towards hiking rates. They know there is a bubble and they are trying to defuse it before it becomes bigger and then they are left with no tools to fight it. We will just have to wait and see with the numerous number of crazy commentary on CNBC and Bloomberg non stop about the Fed's plans. It is getting really ridiculous!!

As we write this futures are down - we expected that heading into Mondays' - typically weak in recent weeks.

Anyway, we expect the markets to consolidate here within a 500 point range - with a topside target of 17000 and low of around 16000. S$P500 to be range bound between 1920 and 2040 range. NASDAQ which was primarily up because of biotech stocks should start seeing some pullback. 

Use this opportunity to lighten up on tech stocks - fundamentally there has been no change in their outlook and forecasts - the trend is down and we expect it to stay that way. With Apple's event coming Sept 9th, we expect that the tech stocks may stay range bound here. We like SLAB for short term trade. We are short AMBA (earnings on Sept 1),SWKS,INTC,PYPL and MU. Our shorts did well for us during this downdraft. We were discussing topping action in the markets and we were ready for it. Long NFLX. We use options to hedge all our positions.

Commodities - oil bounced - expect that to be short lived - we are heading into the slowest season for oil - post summer time. Still some money to be made from short term trading here - check out chart for USO and OIL. Possibly very oversold - should go up for short term. Gold Bounced - we are keeping a close eye on this - as it is tied to the dollar - but with the weaker currencies abroad, we think gold can shine - wait and see.

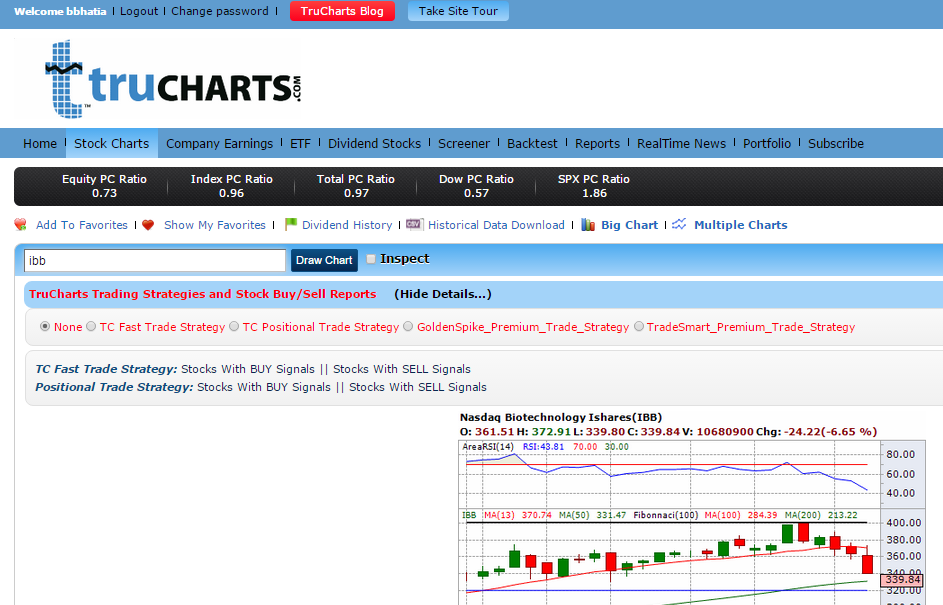
Here are the charts for DIA daily and weekly - Daily chart shows an oversold condition and weekly is not oversold yet. Watch these carefully along with the VIX. We always trade stocks which have underlying options and are very liquid. We like DIS for short term - looks oversold. Do not like biotech - short IBB.


Please check out our site and provide us your feedback and do check our lowest subscription rate in the industry for all the features we offer. Here are some links and thanks for reading and visiting/supporting our site - we are entirely self funded and still losing money but trying our best to provide our users a good experience to make sound and good investment decisions - we offer the automated buy/sell signal strategies for users to see if the stocks in their portfolio is a buy or a sell. Trust me it has saved me a lot of grief in stocks like RIG.SDRL,USO and many more. I am so glad we have that feature.   

We would love to get subscribers so we can keep the site going and it is the price of 2 lattes at Starbucks per month. 

For subscription visit: http://www.trucharts.com/truCharts_Services.aspx

For features we offer visit: http://truchartscom.blogspot.com/p/why-is-trucharts.html


Good luck trading. Stay nimble.

Trucharts Team/Founder/CEO

August 27, 2015

Markets - UP UP and UP. VIX getting clobbered and OIL up..

Markets - UP UP and UP. VIX getting clobbered and OIL up..


Markets are up significantly for the past two days and have recovered over 1000 points on the DOW. Running into some resistance here.  We expected the markets to bounce and were long some high beta stocks like NFLX, NTES and SWKS. We think the markets will stay around this level into next week. We went long BIDU for short term trade and sold/hedged our shorts with some puts and calls. We like the markets heading into tomorrow and would stay long knowing the VIX is coming down. We said pay heed to the VIX since it had exploded on Monday - and sure enough - it worked - wish we had enough cash to had bought some of the big stocks that got clobbered on Monday - we are long NFLX and MBLY. Looks like Fed made some statements regarding rates in Sept and ETF FXI looks oversold.. Always hedge.. 

Oil is up over 8% today - was way oversold - we still think it will bounce for short term here but long term the trend is still down. 

Check out our subscription page at: (we offer the lowest subscription rate for the best feature set of any site on the web) :

http://trucharts.com/truCharts_Services.aspx

Stay nimble in trading.

Good luck.

Trucharts.com team

August 23, 2015

Markets - What to do now? BUY,SELL,IGNORE,HOPE & PRAY


Markets - What to do now? BUY,SELL,IGNORE,HOPE & PRAY - Trucharts.com Weekly Blog Update - week ending 8/21/2015


Well we finally are getting some excitement in the markets.. Before we get into the gist of our discussion today after the amazing week we had - where the DOW plunged over 1000 points and VIX (volatility index) moved up finally, we would like to list the key viewpoints we have been discussing in our past blogs regarding the market action:

  • There has been sideways movements with triple digit moves every week (9-12 weeks)
  • Markets have been exhibiting very clear topping action
  • Narrow Breadth, narrow leadership, New Highs and New Lows ratio skewed to the downside
  • Oil and commodity complex crashing (we said oil dropping was a big deal)
  • China - China - China - over mired in debt and capacity in all sectors
  • WE HAD STATED THAT CHINA WILL HAVE NO CHOICE BUT TO DEVALUE AND THAT IS EXACTLY WHAT THEY DID - IT WAS THEIR DEFACTO STIMULUS AND WE EXPECT FURTHER DEVALUATION OF THE YUAN - headed to 6.7-6.8 to USD range
  • Transports sector down
  • We have been saying sell into any rallies, take profits and hedge your positions
  • DO NOT listen to the talking heads on TV - it is all BS
  • NASDAQ was being buoyed by the biotech stocks and these were going to breakdown and were the new darlings of Wall Street along with the big internet names 
  • Earnings and Revenue forecasts were lower for the next qtr from many sectors -specially the tech sector
  • Valuations in many internet stocks like FB,PYPL,etc were at ridiculous and lofty levels along with the valuations being given to companies like UBER etc in the private placement
  • INTC and MU earnings were key and we had stated that the semi-sector was headed for a major slowdown. We said short INTC,AMBA,SWKS,HAL and MU 
  • We had hedged our longs with covered calls to reduce cost basis 
  • IBB ETF closed below 13 week SMA the week ending 8/14 for the first time in over 15 months
Well now everyone is wondering what next - what are you going to do with your portfolio - Well guess what - we are staying on the same viewpoint and thesis - Sell into rallies, take profits and short IBB (could be the best short). Markets will bounce - but these will be short lived - you can expect more volatility in the next few weeks. You will see clearly below in the charts below that major trendlines have been broken for all indices and the close below major moving averages is a big concern to us. We still like the INTC,MU,AMBA short and are shorting IBB/GILD. We were long NFLX - but with a covered call strategy. We will close half our position and wait for a better entry point. We will look to buy some index ETF on any bounce - target range for DOW is first support 16000 and then around 15000. We think PYPL could be another great short - we are short PYPL.

You can also use our BUY/SELL automated trading strategies on the stockview page to see where sell signals were generated and try to see which stocks in your portfolio are on a SELL signal - do this on weekly and daily charts for your stocks.


Here is the image of trading strategy box on the page above: You have to click to expand the box:


Here are some charts we would like to show this week - look at the trendline and averages - these are weekly charts - please look at RSI and MACD - these are headed down:


Good luck trading, take profits here and now, and sell into any rallies and wait for better entry points. DO NOT LISTEN to the talking heads on CNBC.

We love documentaries and our recommendation for this week is an amazing documentary on smart meters and why you should not allow these in your neighborhood - we live a world of tyranny and corporate corruption and power: You can see this one on AMAZON or YOUTUBE.

Trucharts Team/Founder/CEO

August 21, 2015

Markets - DOWN DOWN DOWN! - Read what we said!!

Markets --- DOWN DOWN DOWN! - Read what we said!!


Well there you have it - DOW down 530 points and NASDAQ down 171 wow!! Just go read all our blog entries and our tweets/fb posts on taking profits and hedging your positions with puts - we talked about the topping nature of the market and we covered some shorts this morning for a tidy profit - we were up all night thinking of trades to do this morning and then got the easy gift of DE (Deere) - we shorted right at the open. We have been short HAL, PYPL and IBB. We closed our IBB short call for 90% profit today - last week in our blog we picked IBB and HAL as top shorts along with PYPL and BABA, INTC, MU.

Good luck trading.. We told you so!!

Closed SWKS short.

Trucharts team


August 19, 2015

Trucharts.com Site Stats

After changing our site name to trucharts.com we are closing on on 100K pageviews - see stats here: this is over 15 months with the most minimalist marketing budget of $200 per month.. Thanks to all our users and please help spread the word. We are still growing without any fanfare. Our return user engagement is over 10 minutes. Our stats were already at 130K+ pageviews when we changed the name - so effectively we are crossing over 220K+ pageviews.

Pageviews
90,113

Unique Pageviews
64,373

August 16, 2015

Is the bull run still intact - Markets ended below 50 day? Are you buying or selling? AAPL, NFLX, and the top horsemen

Is the bull run still intact - Markets ended below 50 day SMA? 

Are you buying or selling? 

AAPL, NFLX, Biotech and the top horsemen


What a week - but we ended the week with the market averages closing below their respective 50d SMAs. Looks ominous and then we had 5 days of non stop news of the Chinese Yuan devaluation - we had stated that this was the only option left for the Chinese and we do not think this is the end  the devaluation - the Chinese Yuan is headed to 6.8-7 relative to the USD. The currency is too strong and with the commodities in a complete crash scenario (from the slowdown in the Chinese economy), the Chinese government has to stimulate their exports by driving down the currency - just like all the other nations in the Pacific Rim - look at Japan.  

Markets moved sideways with minor moves up and down but still ended below their critical averages. We have been saying the markets have been going sideways with many 3 digit moves and topping action. Narrow breadth, narrow leadership, big stocks breaking down and a very high number of stocks below their 50d SMAs. Earnings have been lackluster and so have the forecasts. 

Investors and hedge funds are hiding in the high fliers and the consumer discretionary stocks - which are also starting to show some weakness. Some of the auto parts stocks are doing very well because of strong earnings reports. Dividend stocks are performing well due to the obvious benefits - although we think the dividends from the bigger oil players are at high risk of being cut due to the drop in oil prices and falling margins/profits. We would sell all the big oil stocks here if you own them and move money into cash or some other stocks like REITs and some of the other big industrial companies whose earnings look strong or are not affected by the commodity crash. Oil is headed lower and this creates a huge dilemma for the world over and especially the Middle East nations that rely heavily on oil exports for their economies. We are short HAL.

We have been saying to take profits in the tech sector after Micron (MU) and INTC earnings - this seems to have been the perfect call. Earnings were flat and forecasts going forward were lowered and sure enough all the semi stocks are being beaten down. We were short BABA into the earnings report, along with IBM - both of these shorts worked well for us. Sell AAPL and TXN. We are still short AMBA and SWKS and are looking to short MU.

Now let us look at the Biotech sector - especially the ETF IBB - it closed below the 13 week SMA for the first time in over 15 months and is starting to show technical weakness. We were short and did make money on some of our short calls and short puts. We are still staying short the IBB ETF and expect support for the short term at 50 week SMA at around 340. We think this could be the short of the century (our opinion entirely). Here is the chart:


You can clearly see support at the 50 week SMA.
We still do like AMGN - one of the only high dividend paying stocks in this sector. We would wait to go long AMGN.


We still like the REITs even though we think interest rates are going higher primarily the apartment REITs - with rents going through the roof - we think this will force the Fed to raise rates - rent is one of the components of the inflation index.

We expect the markets to test the 13 weeks SMA this week - around 17800 for the DOW and with the Greek Bailout approved by the Greek parliament - we would expect to see some bounce in the markets. 

Check the weekly charts with 13 week, 50 week, 100 week and 200 week SMA for all the indices on our site - you can use the big charts page at: http://www.trucharts.com/bigcharts.aspx

We have shown here below amazing results from our backtest strategy for IBB using the SMA cross with 14 day exit for 2000 bars - it showed a profit of over 211% - Amazing - we have the the snapshot below for part of the runs - an amazing number of profitable trades, just run the backtest feature and you can see for yourself with the numbers on the left hand side in the snapshot below.


Here is a chart of stock TRMB with our automated buy/sell strategy showing clear buy/sell signals on a weekly chart - a feature that is only offered on our site - to registered members only. This automated buy/sell signal could have made you money and saved you a lot of grief. I hate to say it - we do not believe in buy and hold - that is for sissies.

Good luck trading.

Trucharts team