Watch TWTR here - stock closed strong today. We may trade this one for short term move up. Stock was oversold.
Showing posts with label Buy/Sell Strategy. Show all posts
Showing posts with label Buy/Sell Strategy. Show all posts
January 15, 2015
Trucharts.com - Free stocks and Scans - Markets Update and comments - 01/15/2015
Another down day and we stated in our blog and during the weekly commentary the up move looked like a bull trap and that the markets looked precarious. Earnings are not coming in as expected - and the high expectations were reflected in the high valuations and stock prices - it was like there would be no end in sight - markets were moving up on low volume into the end of the year.
Stocks that do not look good are BBY (Best buy), INTC (Intel), FB (Facebook) - we shorted FB today. We went long gold miners today and we stated that these were looking strong over the weekend - the gold move up was primarily due to the down move for the USD and then the SNB announcement that the Swiss Franc peg to the Euro was no longer in play - that drove gold even higher - this tells us that the Euro is doomed and it will go to par with the USD. A lot of hedge funds exploded today due to the short position in the Swiss franc.
We showed several stocks on our blog that exhibited weak technicals and were flashing sell signals in our weekly commentary on g+ and twitter (@trucharts). We are short IBB, GM, F, DAL and AEM. Long ANV, WSM, USO, LINE, K and BIS.
Click here to access the charts on our site: www.trucharts.com/stockview.aspx
The markets for the short term have not bottomed yet and we should see some technical weakness into the earnings barrage next week. We would short BBY here and our next pick is LAD - we think the auto cycle has peaked and any stock dealing with the auto market is a short - especially dealers and manufacturers (GM, F are examples of stocks we are short). Here is the chart for LAD and it flashed a red sell signal yesterday:
Use our site for auto buy and sell signal strategy. You can save and make money using this excellent proprietary trading indicator.
January 13, 2015
What a day!!! - closing remarks 1/13/2014
Well it sure felt like Friday the 13th today. Markets were up and then pulled back completely. We think it was a bull trap and people are very concerned about the upcoming earnings reports and forward guidance. With oil dropping and the commodity sector (at least for now except gold) falling - looks like there maybe some rough riding here. These type of moves happen when there is tug of war between the bears and the bulls. TIF (Tiffany got massacred yesterday) - Crappy stock SNDK got killed - they were getting the benefit of a bull market and we think the semiconductor run maybe over. Please take profits in this sector until the 2nd half of the year comes around. Technically, today was a bearish day - see chart below for DIA and SPY. You will see lower RSI , lower MACD and the DIA/SPY closed 50d SMA. ALmost looks like a bearish wedge pattern.
We think oil has reached the bottom of its range - we will watch it here carefully and try to establish a position in USO.
We hope to see some good results from the retailers - we will keep an eye on that.
We will close our ABBV position tomorrow - should have closed it today.
We are long AMKR,WSM,K,CYBR,USO and LINE. Short GM,F,AEM,DAL,IBB. We always hedge our portfolio with options and not be all long or all short.


Check out our site and you can clearly see our auto buy/sell signals for your stocks.
GPRO and MU were on the sell signal list 4-5 days ago.
Trucharts team
We think oil has reached the bottom of its range - we will watch it here carefully and try to establish a position in USO.
We hope to see some good results from the retailers - we will keep an eye on that.
We will close our ABBV position tomorrow - should have closed it today.
We are long AMKR,WSM,K,CYBR,USO and LINE. Short GM,F,AEM,DAL,IBB. We always hedge our portfolio with options and not be all long or all short.
Check out our site and you can clearly see our auto buy/sell signals for your stocks.
GPRO and MU were on the sell signal list 4-5 days ago.
Trucharts team
January 4, 2015
Trucharts.com Weekly blog - stocks to watch week ending 01/02/2015
Trucharts.com Weekly blog week ending 01/02/2015
For SEO: Stock Charts Free, Charting, Stock Market, Technical Analysis, Stock Blog, Stock Buy and Sell Signals.
Happy New Year 2015 to all:
Market Stats: DOW 17832.99; S&P500: 2058.20; NASDAQ: 4726.81
| NYSE | Amex | NASDAQ | |
| New Highs | 55 | 5 | 64 |
| New Lows | 23 | 5 | 31 |
| Up Volume | 1,317,747,081 (49%) | 54,149,125 (72%) | 640,070,736 (47%) |
| Down Volume | 1,361,184,794 (50%) | 18,108,068 (24%) | 714,790,713 (52%) |
| Unchanged Volume | 31,963,947 (1%) | 2,449,256 (3%) | 11,961,935 (1%) |
| Total Volume | 2,710,895,822 | 74,706,449 | 1,366,823,384 |
New Year and new resolutions - I am sure Yellen and the Fed have their resolutions already in place - we think there resolution is keep economy on track and no need to raise rates - the dollar strength and weakening economies around the world will bolster the demand for US $ and US bonds - we do not see the bond bubble imploding (at keast yet). Seeing the oil collapse and the Russian ruble collapse is making the US dollar gain more strength and we suspect the Chinese RMB will get weaker - with the Chinese economy slowing - the Chinese will have no choice but to allow the RMB to weaken and make their exports competitive and with the Chinese economy driven by exports to EU and other nations with weakening currencies and economies - the RMB has to fall further. That is our prediction for 2015 - what does this do to gold - with energy prices down we expect gold to drop also - but we will have to keep an eye on this - gold may also become the currency of choice - a tricky catch 22 situation. Oil drop is, we believe, a political driven drop and maybe mixed in with a hint of over-supply. This is affecting major economies like Russia, Venezuela and other major oil-producing nations. We expect oil to be range bound between $45-$70. We went long USO and LINE this week. The economies of US states like Texas, Oklahoma, ND will be affected by this drop in oil price - we will have to see the impact.
Fed action - we do not expect any rate hikes this year as we stated earlier.
Stock bubbles and valuations - There is no doubt we are in a stock bubble - the accounting shenanigans, stock buybacks help moved the stock prices and earnings. Many stocks and sectors are trading at above average PEs - with the Fed holding back on raising rates, we expect stocks to possibly rise this year as there are almost no alternatives to make a decent return. Stocks look extended short-term and we expect a pullback here and will have to keep a close eye on the earnings and forward forecasts for Q1. Semi stocks were downgraded last qtr by BofA Merrill Lynch and this a sign that the semi stocks have had a nice long bull run and we would expect a pullback. Keep an eye on the following stocks SWKS, TXN, ALTR, XLXN, SYNA, MXIM, SIMO etc.
VC funding and company valuations are still outrageous and it smells a lot like 1999.
We also expect major dividend cuts from the energy sector stocks - so please keep a close eye on your small to mid-sized oil and energy stocks with current high payout and high dividend payments - these will definitely impact the stocks prices.
Consumer staple stocks and retail stocks are holding up well and we expect the retail sector to show decent earnings. There have not been any major warnings to date - with the gas prices at the pump dropping, we expect that consumers used this opportunity to spend more on gifts etc during this Christmas season.
Utility stocks had a huge run due to the drop in bond yields and we need to keep an eye on these - there was pullback on Friday - but we expect that this sector will still be strong this year unless there is a bond rout.
We added a new feature to our stock site: Multiple stocks charts on one page - check this link: www.trucharts.com/multiplestocks.aspx.
We additionally added Ichimoku cloud and turtle trading system - these are available on the www.trucharts.com/stockview.aspx.
We will be publishing the definitions and charts for all the indicators on our site soon.
Check out this stock LINE which we went long for a short term trade: www.trucharts.com/stockview.aspx?TICK=LINE.
Gold miner stocks were up on Friday - keep an eye on GDX, GDXJ.
Trucharts positions: Short GM (due to recall), technically stock extended, ALTR, DAL, IBB, AEM. Long USO, CYBR, WSM, K, HMY, LINE.
Best of luck for 2015 and use our site for auto buy/sell signal strategies and as we keep making improvements, we will keep you posted.
Thanks and please help us spread the word - our subscription price is one of the lowest and best in the industry for the type of information we provide to our users and if you have any ideas for improvements or information you would like us to add, please email our CEO and founder directly at bbhatia@trucharts.com - we look forward to your comments and feedback.
Trucharts Team
November 20, 2014
November 19, 2014
Trucharts.com midday update Stock Markets
Trucharts.com midday update Stock Markets
We stated that the markets will be meandering within a range here. We saw a breakout yesterday and we need to see follow through. FOMC minutes were released today and that is affecting the markets. See article below.
Best Stock Charts and Scans - TruCharts.com -
Our AEM short is still looking good. We are long YELP - but we had written covered calls on that position - it is down - but we will hold till December. Still short IBB and biotech.
Looking to short LUV and airline stocks.
Our pick Z and TRLA from the weekend blog did well these past two days - check the charts on our site.
www.trucharts.com/stockview.aspx?TICK=Z
www.trucharts.com/stockview.aspx?TICK=TRLA
http://www.zerohedge.com/news/2014-11-19/fomc-minutes-show-deflation-wary-fed-not-worried-about-global-growth
TruCHARTS team
November 18, 2014
Trucharts.com - Markets Update - Tuesday AM
Stock Charts, Free Scans - Trucharts.com - Markets are meandering here but we expect a melt up - even though it may appear that the markets are topping out - some of the stock action is still bullish and stock picking is selective.
Keep an eye on Z, CYBR, TRLA, VA. BABA is due for a pullback and consolidation, airline stocks are still moving higher due to pullback in oil. Gold is bouncing up due to upcoming Swiss referendum.
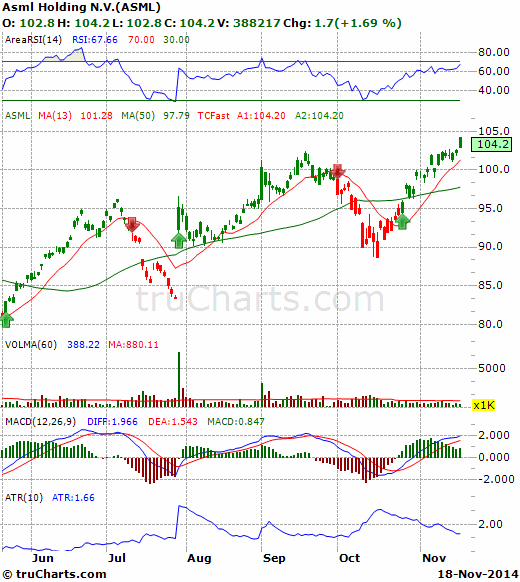
Check here the chart for ASML - with our buy/sell signal strategy.
November 17, 2014
Trucharts.com F stock Update BUY/SELL Strategy
Here is an update on F (Ford) stock - based on our BUY/SELL strategy - stock is up 1.5 from our buy signal in less than one week. Sign up for our subscription service and get access to this feature;
November 14, 2014
Trucharts.com Biotech sector Update
Stock Charts - Free - Trucharts.com - We have been short IBB and biotech sector - check these stocks out today BIIB - down 14 and we think this sector is overbought and ripe for shorting now. Long BIS/Short IBB.
November 13, 2014
Trucharts Positions Update
We are still short IBB (BIOTECH ETF) - we expect there to be profit taking in this sector into the end of the year by mutual funds which are up in this sector for 2014 with very good gains. Long CYBR, short IBB.
Closed USO this morning at a loss. We had a stop limit of 29 and we were stopped out of this postion. We went long CYBR this morning.
Trucharts team
November 12, 2014
November 11, 2014
Trucharts.com Stocks to watch list 11/11/2014
Trucharts.com Markets and Stocks to Watch List
Watch these stocks today:
DHI - reported earnings miss today
ZNGA
BABA
VIPS - earnings this week
BITA - earnings this week
TWC
AMZN - moving higher - chart at:AMZN Chart
Check our earnings calendar at:
http://www.trucharts.com/EarningsView.aspx
Trucharts team
November 9, 2014
Trucharts.com - Stocks to watch week of 11/10 and Blog Update week ending 11/7/2014
Trucharts.com - Blog and markets Update for week ending 11/7/2014
Mid-term elections done - well the GOP won and now we have to see their agenda. Employment news - which was so-so and with that we had, oil rallying after being trounced, gold rallying on Friday after hitting new lows and the gold miners rising. Markets hitting new highs and VIX dropping (as we had been indicating for quite some time) - we still expect the VIX to drop and markets to consolidate their gains here and breadth is narrow. Markets are heading into a strong cycle - end of the year when holiday season starts and into the new year. We do expect to see some pullback from this big move, but move to new highs is still in the cards. With the Fed staying put on interest rates, we do not expect any type of major pullback in the markets. The Fed will not raise rates till next year - and that will drive the markets' direction. With no other avenues to make good returns, investors have no choice but to put the money into markets and now the BOJ announced a round of stimulus to put money into stocks - that just gives the markets more impetus to move higher. Pockets of strength still exits and we need to take advantage of these.
We are looking to the following sectors and stocks next week. Oil and energy stocks/ETFs, gold miners for short term trades.
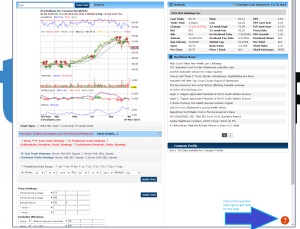
We have added a very helpful feature on our site to help and assist our users on how to use each page and a description of each field on the page. Please check this image below for this feature - it is on each page of our site now (except home page which is under re-design).
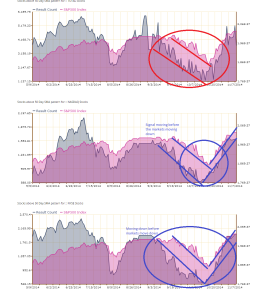
Here we wanted to show below how the sentiment charts from our site predicted this massive move up and the correction we experienced 3-4 weeks ago in the markets - note the drop in the stocks above 50d SMA before the markets actually went down and then the rise in stocks above 50d SMA before the move up in the markets. The signals are very clear prior to the market moves - we have highlighted these with the trend lines. You can see clearly that we are at a top and a sideways market for the next few weeks and possible pullback prior to thanksgiving. As you can see the stocks above 50d SMA is moving down and we are in a topping mode for the markets. We have several such indicators for all the reports we generate on our reports page:
Here is our list of stocks to watch for the coming week:
Buy SIgnal: www.trucharts.com/stockview.aspx?TICK=XOP
www.trucharts.com/stockview.aspx?TICK=NSC
www.trucharts.com/stockview.aspx?TICK=TGT
www.trucharts.com/stockview.aspx?TICK=DO (watch)
www.trucharts.com/stockview.aspx?TICK=ETP
www.trucharts.com/stockview.aspx?TICK=CNQ (short term trade)
Good luck trading.
Here is the udpate from our hedge fund manager for his performance from last week (cumulative return for a $50000 account):
November 4, 2014
Trucharts.com - Help file for REPORTS page - Check this out
TRUCHARTS.com - REPORTS page Help files
Stock Charts - Trucharts.com - Help file for REPORTS page - Here below today we have attached two pcitures showing the details for our reports page and the explanation of the fields - you can also see our mouseover feature - you can access the page at: www.trucharts.com/marketreports.aspx.
October 31, 2014
Stocks to watch Update
Stock to watch Update and Hot Stocks
AAPL up, BIDU up, V up and MA holding here.
Markets are moving higher - here comes the end of year bubble.
We plan to short GM at 32+.
Hot stocks today: GRPO, KLAC - watch these closely and V for move higher.
Trucharts Team
October 28, 2014
Trucharts Buy/Sell Strategy for FCX
Trucharts BUY/SELL Strategy Signal for FCX
Stock Charts - Trucharts.com - BUY/SELL Strategy - Check out here and see where our trade strategy picked a SELL signal for FCX.. Again you could have saved yourself a lot of grief and $$$.. Our Sell signal was generated around 38 and the stock is at 29+ today.
Here is the chart:
Subscribe to:
Posts (Atom)


