Go Daddy Signup

Showing posts with label Biotech Stocks. Show all posts

June 14, 2015

Watch these charts closely this week..

Trucharts.com Blog Week ending 6/12/2015:

Watch these things and charts closely this week..

We did not have a chance to write a complete weekly blog last week due to some family emergencies. Finally got over these and now back to writing and watching and trading the markets this week. 

We are sure you must have been noticing the past few weeks how the big market players have been holding the DOW at 18000, SP500 at 2100 and the NASDAQ at 5000 - rigging - you have to wonder. Every week (for the past six weeks), there has been at least one day a week for a positive 3 digit move in the markets and then we have several - what we call - consolidation days - and then we have had news on Greece everyday impacting the moves in the indices. It is becoming like a same story different day.. Still there has been no resolution on the Greece situation, and then we are seeing some news today that the Greeks have not come forth with a solution that pleases the IMF and the Eurozone. Let us see how this unfolds.

Now back to our markets and China - an amazing bubble brewing there in the markets. A billionaire is made everyday and the three drop out due to improper financial conduct by their respective companies - just take a look at Hanergy as an example. 

We think the underlying fundamentals are weak and many stocks are exhibiting weak technicals, and in addition, we think the tech stocks are looking weak. We strongly recommend taking profits in this sector.

Here are some charts from our markets we are watching closely this week. Keep an eye on the 13 week SMA, the 50 week SMA and the 100 week SMA. Amazing support levels for all the ETFs below.

Charts Weekly: 

Check the chart for:

CVX at critical support - we think this could go to 90.
DIA going to 50 week SMA?
IBB at 13 week SMA - still looking good - still not closing below 13 week SMA.
IWM - Russell 2000 ETF - still strong
MMM - heading to 50 week SMA - should be a good buy point for a bounce
SPY- at week SMA - great support here.
TXN - at 50 week SMA - looking weak - may bounce here
XLK ETF - technology starting to show weakness. (See INTC chart below)


We are long BIDU,CYBR,TWTR,Z, and short AEM,AMBA. Closed DTEA, LLY and UA this week for a good profit.  

IPOs to watch this week: Fitbit - Wednesday - FIT.

Critical earnings this week:

Adobe Systems (ADBE), FedEx FDX, Oracle (ORCL), Darden Restaurants (DRI), Kroger (KR), CarMax (KMX), and KB Home (KBH), DTEA on Tuesday.

Check out our special subscription offer - just $90 for the whole year. The best deal of any technical and stock charting website on the web. Here is the link: 
http://www.trucharts.com/truCharts_Services.aspx

Check out the results of our backtest feature - the fastest on the web: This is for IBB ETF with a 8 SMA crosses 12 SMA and exit is 11 days after crossover - the short needs to be optimized - but the long strategy shows a 174% return.


June 5, 2015

Keep an eye on these stocks and charts!!

Trucharts.com Blog Brief Update:

For SEO:  

Stock Chart(s) Free - Trucharts.com - MACD Chart - Charting, Technical Analysis, Hot Stocks, Real time Stock news:

Here are some stocks we like and are long and also keeping a close eye on:

Jobs reports was strong and USD is moving up and treasuries are dropping and yields are moving higher. Gold down - we are short AEM.

1. DTEA - went IPO today - we are long
2. UA - breaking out of a base - challenging NIKE
3. CYBR - we went long today
4. TIF - like it  - but closed this position
5. BIDU - love this stock 
6. QIHU - looking good for short term trade and China momentum

Charts to watch for SPY and IBB - check the 13 week SMA and 50 week SMA:


May 31, 2015

Markets Direction - Up or Down? Where are we headed? Trucharts.com Blog Update

Markets Direction - Up or Down? Where are we headed? Weekend Blog Update week ending 5/29/15

We have not had a chance to do a weekend update due to the jet lag from travel and other pressing matters. Finally getting some time to put my thoughts down related to the markets from the past 3 weeks and heading into the summer session.

Well NASDAQ hit a new high, markets moved higher and many earnings were reported. Avago bought Broadcom - a $37B acquisition (we think they paid too much - almost 5.5x sales) and then we have Intel buying ALTR this week - from an earnings we had HD, LOW and many other companies that reported earnings in the past couple of weeks. ULTA also reported but the stock reversed after reporting its earnings as did HD. There is talk of additional mergers in the semi company space - here are the companies that we think are ripe for consolidation - MXIM, IDTI, TXN, SLAB, MCHP, ADI, NVDA, AMD, SWKS, MRVL, XLNX, AMBA and probably many others we are missing.  Keep an eye on these stocks. NXPI, AVGO, INTC and other big semi companies would be possible acquirers. With the AVGO and BRCM merger - the merged company will be the 3rd largest semiconductor company after INTC (1) and QCOM (2).

Our drug stock picks LLY, MYL and TEVA still holding strong. The biotech sector has been holding the NASDAQ up and we expect that this sector will eventually fall - we just cannot predict when - there is technical weakness in the ETFs in the biotech sector.

We are very concerned about the underlying weakness in the markets - structurally. We are seeing many stocks breaking down in the DOW and S&P500. In addition, stocks are reversing after reporting earnings - check HD, ULTA. Housing stocks are dropping - indicating that the markets are anticipating rate hikes from the Fed. We think the Fed sees an asset bubble and are being left with no choice but to start raising the Fed funds rate. Housing prices are moving up. unemployment is down to 5.3%, homes on the west coast are selling at prices higher than asking - and this has been the longest period for the rates being at near zero - now close to 6+ years and over the past week we posted an article on FB and G+ where Byron Wein discusses how the Fed has pumped over $3T into the markets - we concur. And then we see this article over the weekend:

All these are pointing to over valuation in the markets and the complacency is remarkable. The VIX was down last week and we expect this to spike higher in the coming weeks. We stated that we would take profits here and hedge positions with calls and puts. Adding some shorts is in our plan for the coming week.  We are long BIDU, TWTR, Z (all hedged with covered calls) and are looking to short MSFT, and possibly IBM. 

Just take a look at the stocks that popped on our sell signal strategy here:Just sort the page by volume from highest to lowest by clicking on the volume column twice: 

Watch for our regular daily posts and positions updates on Twitter and FB.

Again - watch the Greek situation, China stock bubble, and sell here to take some profits and wait for a better opportunity.

Good luck trading. Check out our special subscription rates and we offer the best feature set on the web for our lowest subscription rates - here is the link: 

Do checkout our backtest feature - it is the fastest on the web and ummatched by any site.
Link is: Backtest feature - play with it and you can use it to try some paper trades.

Please help by spreading the word of our site.

Trucharts founder and team

May 27, 2015

Stock Market 5/28 - Midday Update Tuesday - Trucharts.com -

Midday Market update: 5/27


Stocks are bouncing back from the drop yesterday post Memorial day holiday from a possible buy the dip philosophy and possible Greece solution. 

We doubt this move/rally and would look to sell into rallies and take profits - NASDAQ is up from the biotech stock moves and some tech stocks. We like $DE, $BIDU and went long $TIF today. Stocks getting hammered are $WDAY, $KORS and $SHAK.  We like $MO and the tobacco stocks for their dividends and would look to go long. Short gold for now.

Markets look extended still and volatility is still low. Oil is dropping. Watch SVXY and VXX.

April 5, 2015

How to trade this week after the bad jobs report?

Trucharts.com - Blog - Easter Weekend - Stock Charts Free - and more.

How to trade post Easter and what to expect?

We talked about the horrendous job reports we got on Friday in our last blog update - just a reminder the reports showed 126K jobs created vs the expectations of 226K. Futures dropped on the news and the USD dropped - gold rallied and then we had oil rallying this weekend with the Saudi's raising the price of oil to the Asian nations because of demand. In addition, we have the nuclear deal with Iran and then the war going on in Yemen - this is definitely going to impact the oil price volatility. Gold is up today over $12+.

The talking heads on TV are already trying to predict the Fed's move in Q3 and we still expect that the Fed will raise rates in Q3 unless the jobs report stays below 150K. With summer coming, we expect the jobs report to improve going forward. 

Futures are down this evening (DOW futures down -115) after recovering from a 200 point drop and everyone is already trying to predict whether the Fed is going to hold off on raising rates based on one jobs report (which we think is a blip) and should resume an upward trend next month. The weather did have an impact and we suspect hiring in the oil sector was down. 

We indicated that the earnings news has not been very encouraging and we expect that the forecast for the tech sector for Q2 will not be strong. With INTC and SNDK lowering revenue forecasts, we expect numbers to be coming down in the tech sector - recommend taking profits in this sector. We are looking to short TSM and SPIL.

Since we now have to wait till the next jobs report, we expect that bonds will rally here and yields will drop and this will help the utility and dividend paying stocks to shine at least for the short term, in addition to retail/housing stocks. We like the following stocks:

MO - (we are long) www.trucharts.com/stockview.aspx?TICK=MO
RAI - www.trucharts.com/stockview.aspx?TICK=RAI
LO - www.trucharts.com/stockview.aspx?TICK=LO
M - www.trucharts.com/stockview.aspx?TICK=M
PHM - www.trucharts.com/stockview.aspx?TICK=PHM

We are short SNDK, and long USO, BIDU, MO, TWTR. We still like TWTR and you can also check out our predefined scans report on our site at www.trucharts.com/marketreports.aspx.

Also check out our special subscription deals for complete access to our site at:
www.trucharts.com/charts_services.aspx

Good luck trading.

Trucharts Team

March 31, 2015

Are you buying or selling? We are selling..

Trucharts.com - Free Stock charts - MACD charts & Technical Analysis

Markets pulled back today giving up most of the wonderful gains yesterday - a bull trap. We stated to take profits in the rally and hedge your positions. We are heading into earnings season and be ready for some nasty surprises from the tech sector for Q2 earnings, and energy sector earnings. Gold has been dropping and oil has been pushed down to a potential nuclear agreement with Iran and what this will do the current glut situation. Biotech stocks were getting clobbered today and we think this is profit taking in this sector by the mutual funds for end of quarter performance numbers. The biotech sector has been moving up in an exponential fashion and we are still short IBB. Be prepared - we are already in the sixth year of this bull market and expect a pullback and maybe a meaningful is coming. Check out our automated trading strategies on our site to see if your stock is on a buy/sell signal. We are long TWTR. and short SMH.

In addition, we are recommending selling AAPL. 

UPDATED:

Read this: Our theory of a top forming.


http://www.zerohedge.com/news/2015-03-31/april-anxiety-75-year-itch

Trucharts Team

March 16, 2015

Weekly Stock Blog 03/13/15 - Stocks to Watch and some good reads - Trucharts.com

Trucharts.com - Weekly Blog ending 03/13/15 - Good reads and Hot Stocks to watch

Sorry for the late posting - had some family obligations to tend to. 

What an amazing week in the markets - very volatile moves up and down - sounds like a roller coaster to me. We stated in our previous blog that the range would be between 2080 and 2050 for the SP500 and that is what we saw this past week. The markets rallied today and the resistance in the SP500 was expected to be 2080 and the DOW resistance around 18000 which is right at the 13d moving average. We will have to wait and see if the markets can break above this range now or will it consolidate or see a breakdown. 

With the BIGGEST news this week expected to be the Fed view on future interest rates - this is expected on Wednesday - economists are split evenly on what the Fed will do and we think that the Fed will stay put on rates till Fall or September knowing that the inflation pressures are muted due to the fall in oil prices. With the strong dollar and negative rates in the Eurozone, we do not see how the Fed will move to raise rates - the only concern on the Fed's mind will be asset bubbles in real estate and stocks. 

Here are some very good articles and reads for Fed interest rates:
Markets rallied today due to the USD pulling back from an extended move up - but we still like the USD - euro is headed lower and we think this may be a short term pullback into a bullish move in the USD. Again, we would expect to see a move after the Fed's comment on Wednesday on interest rates.

Let us take a look at some of the commodities - oil hit a new low today and is heading to our target price of $40 - the oil stocks bounced today - maybe a sign of some bottom in the oil sector - especially knowing that we are heading into the summer season. Keep an eye on the oil sector stocks.

We are long USO and short the calls against our position.

Gold is languishing here pending the Fed's view on rates and is still looking weak. Wait and watch.

We have been watching the Utilities sector stocks (XLU - ETF) as this sector has corrected over 20% due to the move up in yields and move down in bonds, and the move up in USD. We discussed this sector over the weekend in our meetup and pointed to stocks as (www.trucharts.com/stockview.aspx?TICK=SO), and (www.trucharts.com/stockview.aspx?TICK=PCG) - these moved up over 2% today. XLU is looking strong at the close of markets today.

We went long SO today and are long BIDU, USO, TWTR, BOX, Z, ANGI and LLY.  We are short UAL. Looking to go long AMGN.

The pharmaceutical sector - especially the BIOTECH sector took off again today - due to news from AMGN and Sanofi on the cholesterol drug findings - http://www.marketwatch.com/story/amgen-other-drug-company-shares-jump-on-cholesterol-drug-findings-2015-03-16?siteid=yhoof2. AMGN closed strong today and we like the stock. BMY broke out and LLY is also looking strong. Here are the charts:

AMGN stock chart
BMY Stock Chart

The tech sector looks interesting - we are very concerned after the INTC (www.trucharts.com/stockview.aspx?TICK=INTC) news of a lower revenue forecast. 

We expect that MSFT will also be impacted by this news as will the component suppliers to the the PC sector. There are some stocks that look very extended - NXPI, AVGO and SWKS.

Here are some other articles for reading:


Good luck trading.


Trucharts team


March 8, 2015

Trucharts.com - Markets, Hot Stocks, Blog week ending 3/6/2015

Trucharts.com Blog week ending 3/06 and Hot Stocks to Watch Week of 3/9
What a jobs report - wow!! - even our numbers were not close enough to the actual numbers. Our estimate for March jobs report was around 230K on the high side and the number came in at 295K and unemployment rate dropped to a respectable 5.5%. We do not expect any slowdown heading into the summer season - the US dollar rallied and gold got crushed - we stated that gold was heading down in our previous posts - and here comes the probability that the Fed will be pushed to raise the Fed funds rate by June - we expect even that if they raise it by 0.25bp - would still be too low to affect the markets. There will likely be a short-term pullback - we indicated in our posts on fb and g+ that the markets looked extended and a pullback to 2050 should be expected. Also Mar 9th will be the 6 year anniversary of the bull market. The markets will be on the watch out for Fed statements going forward and the strength of the US dollar maybe hurting the export driven companies, but is a good sign for the US and the US economy. There should be some concern around job losses related to the oil industry - which we would expect to see happen within the next few months. We heard on the news of layoffs from HP and Ebay. But job hiring scene is still strong in many sectors. Majority of the job growth was in the in the service industry in the March jobs report. With the Fed still staying the course with ZIRP - we expect that the markets will consolidate here with some pullback heading into the Q2 earnings season. Support for the S&P is in the 2050 area.
Check out the videos and articles we posted on our G+ and FB pages.
Market Stats (from finance.yahoo.com) Friday close:
DOW JONES IND: 17856.78 - DOWN -278.94; S&P500: 2071.26 - DOWN -29.78; NASDAQ: 4927.37 - DOWN -55.44
ADVANCERS/DECLINERS: NYSE: 308/1574; (RATIO ~ 1:3) - NASDAQ: 858/1944 (RATIO ~ 1:2)
UP VOL/DOWN VOL (Millions): NYSE: 673/3177 (~1:5); NASDAQ: 541/1308 (~1:3)
We have been short AEMIBB (has been hurting but is a hedged position), Long ANGITWTR, Z, USO, DATA, LLY.
All of pur positions have calls or puts written against the position(s).
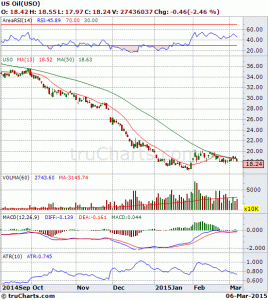
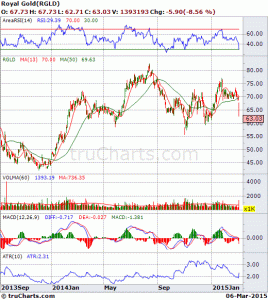
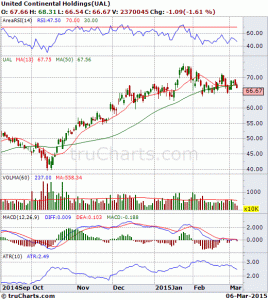
Here are stocks we are watching this week: Looking to short RGLD (or buy puts), Short UAL or buy puts and USO looks like it is pointing to lower oil prices - we have covered calls on USO. Here are the charts.
USO Stock ChartRGLD Stock ChartUAL Stock Chart


Check out the charts we posted in our blog last week.

Good luck trading - please check our page - Why Trucharts.com at: http://truchartscom.blogspot.com/p/why-is-trucharts.html.

Trucharts Team

February 22, 2015

Trucharts.com - Hot stocks to watch and - Blog week ending 2/20/2015

Trucharts.com Blog week ending 2/20/2015 - And Stocks to Watch for the coming week and markets

Well another week and another set of new highs for all the indices - S&P, Dow and NASDAQ (headed to 5000) - We have been saying that what we experienced the week before was a breakout of descending triangle pattern and the markets just moved higher after the breakout. The Eurozone Greek situation is just noise and it is totally irrelevant to the markets in the US. That has been our theme and it has made money for us. Although we are seeing fewer stocks participating in this move up - nevertheless, the markets are heading higher. We expect a pullback to the 13d SMA and we should be mindful of that. We still like certain stocks and we will discuss these below. The Russian issue with Ukraine - just more noise - and Putin is going to keep the West on its toes - while the West is going to keep putting pressure on Russia by driving the price of oil lower - we expect this to be a bottoming process for oil and should last through summer this year. Gold is pulling back as the market moves higher and we are short AEM (www.trucharts.com/stockview.aspx?TICK=AEM) We are long USO and will keep writing covered calls on the USO position.

Our picks from our blog last week did very weel - TWTR, CYBR, USO, LINE - we closed LINE and CYBR this week.
Markets on Friday moved up due to the loan extension granted to Greece for 4 months - and the markets just rocketed higher - even with narrowing breadth/leadership. NASDAQ is being driven by the biotech sector and this weekend SLXP is being bought by Valeant for ~10B.

Next week we expect the Fed to keep the patient theme in their language to the Congress and here is a good article on earnings and news for what will drive the markets next week:

Here are the market stats from Friday close(check the New Highs and New Lows on the NYSE and NASDAQ - lopsided to the New Highs) - means the markets are still seeing a fair number of new highs relative to new lows with market at all time highs - still a bullish sign:

Advances & Declines
NYSE
AMEX
NASDAQ
Advancing Issues
2,143 (66%)
206 (51%)
1,427 (51%)
Declining Issues
1,005 (31%)
170 (42%)
1,263 (45%)
Unchanged Issues
90 (3%)
26 (6%)
106 (4%)
Total Issues
3,238
402
2,796
New Highs
164
9
131
New Lows
14
7
31
Up Volume
2,197,896,660 (67%)
58,220,649 (51%)
1,081,999,545 (63%)
Down Volume
1,044,822,426 (32%)
54,108,506 (47%)
594,106,069 (35%)
Unchanged Volume
53,196,027 (2%)
2,284,090 (2%)
32,536,265 (2%)
Total Volume
3,295,915,1131
114,613,2451
1,708,641,8791

Here are the stocks we will be watching this week and we especially like: KLAC, ALTR, Z, ANGI - check out the weekly charts for Z, ANGI and ALTR here below:

(Check the volume for ANGI) - we want to clearly warn you that these are risky stocks - the charts are for information purposes only. We will be looking to buy these based on our analysis.

Zillow stock chart


ANGI Stock Chart


Here are some other charts of interest this week:

www.trucharts.com/stockview.aspx?TICK=ALTR (we closed this week for 4.5% profit)

We closed out GM and F short spread for a small loss - we could have stayed short but decided to close these.

Check out our special subscription rates for new subscribers at:  http://www.trucharts.com/truCharts_Services.aspx

For SEO: Charts, Charting, Free Stock Charts, Free trading, Stock Screener, Dividend Stocks, Hot Stocks, MACD, Candlestick patterns.

Best of luck Trading.

Trucharts.com Founder/CEO