Go Daddy Signup

Showing posts with label Charting. Show all posts

May 21, 2015

BIDU and TEVA update

Updates on our picks - Trucharts.com - 


Stock Chart(s) Free - Trucharts.com - MACD Chart - Charting, Technical Analysis, Hot Stocks, Real time Stock news:


We had picked BIDU and TEVA yesterday - both of these are up today - BIDU is up over $3 and TEVA is up over $1.25. We expect markets to be volatile next week post Memorial day weekend. We would sell into rallies - take some profits here.

Trucharts Team

March 26, 2015

Is the market top in???

Trucharts.com - Stock Chart Free, Screener, Scans, and much more - 


Another interesting fact - we have not seen an pre-announcements for upside surprises this quarter - means earnings may not be as strong as Wall Sreet thinks and with INTC and SNDK lowering their forecasts, we expect that semiconductor industry is entering a slump. Majority of the Q4 demand last year was driven by computer upgrade cycle and Iphone 6. 

Remember we talked about the three 6 factor - 6th year of bull market, Iphone 6 and the Samsung galaxy 6 - and the market bottoming at 666 in 2009.. Hmmm!!!! is the top in!! 

Take profits - Short SNDK.

UPDATED:


Check these support levels for ETF IBB: 13 week and 50 week SMA have been great support before. See the two circles.


Trucharts team

March 18, 2015

Bought these hot stocks today - Markets Rally today

Market Rally 3/18/2018 - Thanks Ms Yellen - Greatly appreciated 

CORRECTED LINKS..IN THIS UDPATE..

Well today's Fed output (scientific term) was all but nonsense and as expected - the markets had done a classic bear trap and sucked everybody in. Our expectation was to stay net long and our picks from our blog this past week was right on the money - Euro rallied, Gold rallied, Oil rallied and the Fed will keep blowing bubbles till it learns a lesson it will never forget - till then keep partying.


We mentioned the XLU, SO, PCG, LLY and BIDU in our blog this past week and as part of our holdings - all of these stocks rallied hard today - staying long and going long more on BIDU or LLY..


Here are the charts:


www.trucharts.com/stockview.aspx?TICK=LLY


www.trucharts.com/stockview.aspx?TICK=BIDU


www.trucharts.com/stockview.aspx?TICK=XLU


www.trucharts.com/stockview.aspx?TICK=SO


www.trucharts.com/stockview.aspx?TICK=PCG


Good luck trading. 


Founder/CEO

Trucharts.com

March 16, 2015

Weekly Stock Blog 03/13/15 - Stocks to Watch and some good reads - Trucharts.com

Trucharts.com - Weekly Blog ending 03/13/15 - Good reads and Hot Stocks to watch

Sorry for the late posting - had some family obligations to tend to. 

What an amazing week in the markets - very volatile moves up and down - sounds like a roller coaster to me. We stated in our previous blog that the range would be between 2080 and 2050 for the SP500 and that is what we saw this past week. The markets rallied today and the resistance in the SP500 was expected to be 2080 and the DOW resistance around 18000 which is right at the 13d moving average. We will have to wait and see if the markets can break above this range now or will it consolidate or see a breakdown. 

With the BIGGEST news this week expected to be the Fed view on future interest rates - this is expected on Wednesday - economists are split evenly on what the Fed will do and we think that the Fed will stay put on rates till Fall or September knowing that the inflation pressures are muted due to the fall in oil prices. With the strong dollar and negative rates in the Eurozone, we do not see how the Fed will move to raise rates - the only concern on the Fed's mind will be asset bubbles in real estate and stocks. 

Here are some very good articles and reads for Fed interest rates:
Markets rallied today due to the USD pulling back from an extended move up - but we still like the USD - euro is headed lower and we think this may be a short term pullback into a bullish move in the USD. Again, we would expect to see a move after the Fed's comment on Wednesday on interest rates.

Let us take a look at some of the commodities - oil hit a new low today and is heading to our target price of $40 - the oil stocks bounced today - maybe a sign of some bottom in the oil sector - especially knowing that we are heading into the summer season. Keep an eye on the oil sector stocks.

We are long USO and short the calls against our position.

Gold is languishing here pending the Fed's view on rates and is still looking weak. Wait and watch.

We have been watching the Utilities sector stocks (XLU - ETF) as this sector has corrected over 20% due to the move up in yields and move down in bonds, and the move up in USD. We discussed this sector over the weekend in our meetup and pointed to stocks as (www.trucharts.com/stockview.aspx?TICK=SO), and (www.trucharts.com/stockview.aspx?TICK=PCG) - these moved up over 2% today. XLU is looking strong at the close of markets today.

We went long SO today and are long BIDU, USO, TWTR, BOX, Z, ANGI and LLY.  We are short UAL. Looking to go long AMGN.

The pharmaceutical sector - especially the BIOTECH sector took off again today - due to news from AMGN and Sanofi on the cholesterol drug findings - http://www.marketwatch.com/story/amgen-other-drug-company-shares-jump-on-cholesterol-drug-findings-2015-03-16?siteid=yhoof2. AMGN closed strong today and we like the stock. BMY broke out and LLY is also looking strong. Here are the charts:

AMGN stock chart
BMY Stock Chart

The tech sector looks interesting - we are very concerned after the INTC (www.trucharts.com/stockview.aspx?TICK=INTC) news of a lower revenue forecast. 

We expect that MSFT will also be impacted by this news as will the component suppliers to the the PC sector. There are some stocks that look very extended - NXPI, AVGO and SWKS.

Here are some other articles for reading:


Good luck trading.


Trucharts team


March 12, 2015

Markets Rallied Hard today and here are the reasons why


Free Stock Charts - Trucharts.com - Auto Buy/Sell Signal Strategies -


Markets rallied hard today - this was due to several factors:


1. VIX was up for the past few days

2. Dollar had rallied significantly in the past few weeks and was due for a pullback. 

3. Euro rallied from an oversold condition - but this move up will be short lived with the current negative interest rate environment in the Eurozone

4. Retail Sales were down and that inspired the bulls to think that the Fed would be refrained from raising rates in June

5. Health Stocks and utility stocks were looking oversold and therefore there was a good bounce - we expect a test of 2025 on the SP500 and we went long BIDU today with a covered call strategy - we discussed this strategy in our blog yesterday.
  • Check out our site for auto buy and sell signals for any stock, check out our real time news feature for before and after hours news and updates. We have technical mouseover charts for very quick technical analysis on our reports and earnings page.

Good Luck Trading.


Trucharts team 

March 1, 2015

Trucharts.com - Weekly blog week ending 2/27 - Hot Stocks to Watch

Trucharts.com Blog week ending 2/27/2015 - Markets and Hot Stocks, stocks and thoughts for the coming week

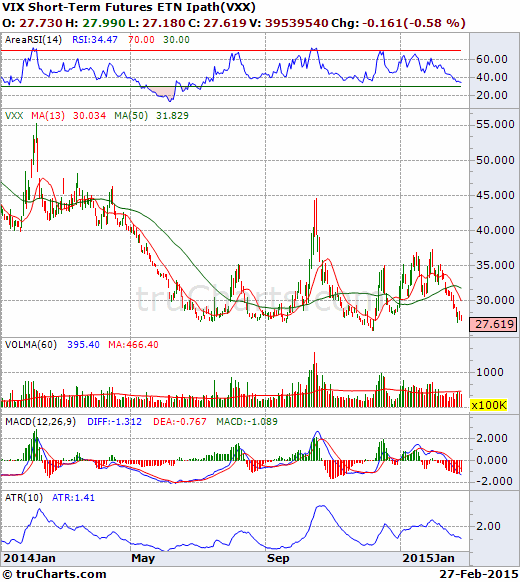
VIX dropping and the complacency is truly remarkable. Just check the chart here for VXX etf still heading down and we expect this to find a bottom and stabilize - the technicals are not pointing to any big move yet in volatility. We are heading into the sixth year of the bull market from the March 2009 bottom - earnings have been reasonable with some surprises and stocks which have beaten the estimates and raised forecasts have been rewarded their investors nicely. Check AVGO and CRM as examples. 
VXX chart:
VXX ETF Chart
Oil dropped this week and gold stabilized around 1200 - we think gold will vacillate around 1175 - 1250 until there is an actual breakdown. We posted some good videos this week on the Fed's interest rate policy conundrum and how they have put themselves in a corner - and with the current ZIRP, we expect markets to trend higher after another consolidation phase here. A pull back to the 13 day SMA or even the 50d SMA would be a decent pullback. The leadership in stocks is narrowing and the breadth is narrowing also.  Here is the chart for SPY (check the technicals weakening RSI and MACD):

Target support is between 208 - 205 (around 2080 and 2050 for S&P500):
SPY chart
We expect oil to head down and try to form a bottom before heading higher into the summer season. Gas prices in California are still high due to some refinery shutdowns, labor strikes. We expect oil prices to stay between 40 - 55.
Greece which got its loan stay/extension - we just call it noise and the Euro is getting crushed. We are in an all out currency war now and we really like the US dollar here - as there is no other currency that is currently safe. This will impact gold prices as the USD heads higher.
Ukraine is in total disaster mode, Venezuela is sinking - Russia us struggling and China is slowing down. Japan is mired in debt and all it can think of doing is cheapen its currency.
Stocks that have triggered short signals are in the airline sector - check the chart here for DAL, UAL and LUV:
Also take a look at the chart for CAT here below:
Stocks on our list for longs are:
Additional stocks we are watching are: LLYALTR.
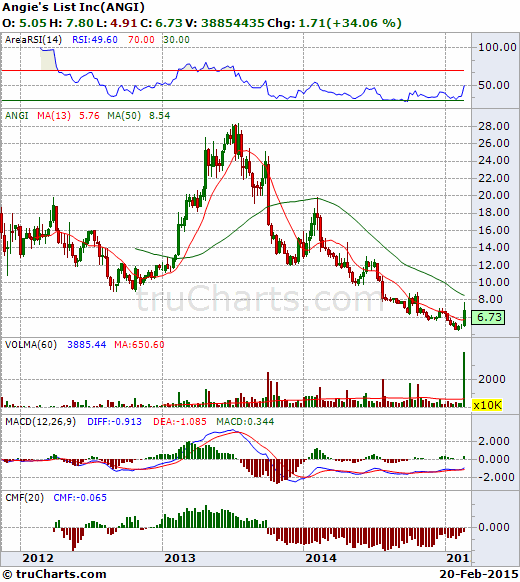
Our long positions with options are in the following stocks: LLY, USO, ANV, DATA, Z, TWTRANGI
As we indicated in our blog 2 weeks ago - our call on ALTR was excellent - we locked our profits based on the buy signal generated from our Fast Trading Signal Strategy. Profit was 4.5% and ALTR has hit 37 since our buy call around 34.7.
Check these trading strategies on our stock charts page at: www.trucharts.com/stockview.aspx 
Market Stats: (from finance.yahoo.com)

S&P 500: 2,104.50 -6.24 (-0.30%); Dow: 18,132.70 -81.72 (-0.45%); Nasdaq: 4963.53 -24.36 (-0.49%)

Advancers & Decliners


NYSE
AMEX
NASDAQ
Advancing Issues
1,614 (50%)
228 (57%)
1,034 (37%)
Declining Issues
1,530 (47%)
157 (39%)
1,676 (60%)
Unchanged Issues
93 (3%)
18 (4%)
91 (3%)
Total Issues
3,237
403
2,801
New Highs
99
6
105
New Lows
30
6
35
Up Volume
1,587,571,140 (45%)
87,795,645 (71%)
737,990,334 (39%)
Down Volume
1,903,862,936 (54%)
34,160,800 (28%)
1,151,918,788 (60%)
Unchanged Volume
60,957,743 (2%)
999,147 (1%)
24,153,883 (1%)
Total Volume
3,552,391,8191
122,955,5921
1,914,063,0051

Twitter handle: @trucharts; https://www.twitter.com/trucharts

Good luck trading - please check our page - Why Trucharts.com at: http://truchartscom.blogspot.com/p/why-is-trucharts.html

B Bhatia
Founder/CEO

February 22, 2015

Trucharts.com - Hot stocks to watch and - Blog week ending 2/20/2015

Trucharts.com Blog week ending 2/20/2015 - And Stocks to Watch for the coming week and markets

Well another week and another set of new highs for all the indices - S&P, Dow and NASDAQ (headed to 5000) - We have been saying that what we experienced the week before was a breakout of descending triangle pattern and the markets just moved higher after the breakout. The Eurozone Greek situation is just noise and it is totally irrelevant to the markets in the US. That has been our theme and it has made money for us. Although we are seeing fewer stocks participating in this move up - nevertheless, the markets are heading higher. We expect a pullback to the 13d SMA and we should be mindful of that. We still like certain stocks and we will discuss these below. The Russian issue with Ukraine - just more noise - and Putin is going to keep the West on its toes - while the West is going to keep putting pressure on Russia by driving the price of oil lower - we expect this to be a bottoming process for oil and should last through summer this year. Gold is pulling back as the market moves higher and we are short AEM (www.trucharts.com/stockview.aspx?TICK=AEM) We are long USO and will keep writing covered calls on the USO position.

Our picks from our blog last week did very weel - TWTR, CYBR, USO, LINE - we closed LINE and CYBR this week.
Markets on Friday moved up due to the loan extension granted to Greece for 4 months - and the markets just rocketed higher - even with narrowing breadth/leadership. NASDAQ is being driven by the biotech sector and this weekend SLXP is being bought by Valeant for ~10B.

Next week we expect the Fed to keep the patient theme in their language to the Congress and here is a good article on earnings and news for what will drive the markets next week:

Here are the market stats from Friday close(check the New Highs and New Lows on the NYSE and NASDAQ - lopsided to the New Highs) - means the markets are still seeing a fair number of new highs relative to new lows with market at all time highs - still a bullish sign:

Advances & Declines
NYSE
AMEX
NASDAQ
Advancing Issues
2,143 (66%)
206 (51%)
1,427 (51%)
Declining Issues
1,005 (31%)
170 (42%)
1,263 (45%)
Unchanged Issues
90 (3%)
26 (6%)
106 (4%)
Total Issues
3,238
402
2,796
New Highs
164
9
131
New Lows
14
7
31
Up Volume
2,197,896,660 (67%)
58,220,649 (51%)
1,081,999,545 (63%)
Down Volume
1,044,822,426 (32%)
54,108,506 (47%)
594,106,069 (35%)
Unchanged Volume
53,196,027 (2%)
2,284,090 (2%)
32,536,265 (2%)
Total Volume
3,295,915,1131
114,613,2451
1,708,641,8791

Here are the stocks we will be watching this week and we especially like: KLAC, ALTR, Z, ANGI - check out the weekly charts for Z, ANGI and ALTR here below:

(Check the volume for ANGI) - we want to clearly warn you that these are risky stocks - the charts are for information purposes only. We will be looking to buy these based on our analysis.

Zillow stock chart


ANGI Stock Chart


Here are some other charts of interest this week:

www.trucharts.com/stockview.aspx?TICK=ALTR (we closed this week for 4.5% profit)

We closed out GM and F short spread for a small loss - we could have stayed short but decided to close these.

Check out our special subscription rates for new subscribers at:  http://www.trucharts.com/truCharts_Services.aspx

For SEO: Charts, Charting, Free Stock Charts, Free trading, Stock Screener, Dividend Stocks, Hot Stocks, MACD, Candlestick patterns.

Best of luck Trading.

Trucharts.com Founder/CEO

January 21, 2015

Trucharts.com - NFLX and JAZZ buy signals - check this out


Free Stock Charts, Auto Buy/Sell Signals - Trucharts.com:


Market closed up today - we had a 7:3 advances to decliners on the NYSE. NASDAQ and Amex were almost even advances to decliners. S&P closed almost at the highs and then there was NFLX - probably caught a lot of folks short in this position covering their positions - but the numbers for NFLX were strong and we believe this stock (even though expensive) is going higher. Check out these very interesting charts below. On both these stocks JAZZ and NFLX our trading strategy generated BUY signals yesterday - this strategy is a leading indicator and both stocks JAZZ and NFLX were up today strongly. This feature can be accessed on our site on the stock charts page. The link is www.trucharts.com/stockview.aspx - look under Trucharts Trading Strategies under the chart. Amazing buy signals.