Go Daddy Signup

Showing posts with label Hot stocks. Show all posts

August 23, 2015

Markets - What to do now? BUY,SELL,IGNORE,HOPE & PRAY


Markets - What to do now? BUY,SELL,IGNORE,HOPE & PRAY - Trucharts.com Weekly Blog Update - week ending 8/21/2015


Well we finally are getting some excitement in the markets.. Before we get into the gist of our discussion today after the amazing week we had - where the DOW plunged over 1000 points and VIX (volatility index) moved up finally, we would like to list the key viewpoints we have been discussing in our past blogs regarding the market action:

  • There has been sideways movements with triple digit moves every week (9-12 weeks)
  • Markets have been exhibiting very clear topping action
  • Narrow Breadth, narrow leadership, New Highs and New Lows ratio skewed to the downside
  • Oil and commodity complex crashing (we said oil dropping was a big deal)
  • China - China - China - over mired in debt and capacity in all sectors
  • WE HAD STATED THAT CHINA WILL HAVE NO CHOICE BUT TO DEVALUE AND THAT IS EXACTLY WHAT THEY DID - IT WAS THEIR DEFACTO STIMULUS AND WE EXPECT FURTHER DEVALUATION OF THE YUAN - headed to 6.7-6.8 to USD range
  • Transports sector down
  • We have been saying sell into any rallies, take profits and hedge your positions
  • DO NOT listen to the talking heads on TV - it is all BS
  • NASDAQ was being buoyed by the biotech stocks and these were going to breakdown and were the new darlings of Wall Street along with the big internet names 
  • Earnings and Revenue forecasts were lower for the next qtr from many sectors -specially the tech sector
  • Valuations in many internet stocks like FB,PYPL,etc were at ridiculous and lofty levels along with the valuations being given to companies like UBER etc in the private placement
  • INTC and MU earnings were key and we had stated that the semi-sector was headed for a major slowdown. We said short INTC,AMBA,SWKS,HAL and MU 
  • We had hedged our longs with covered calls to reduce cost basis 
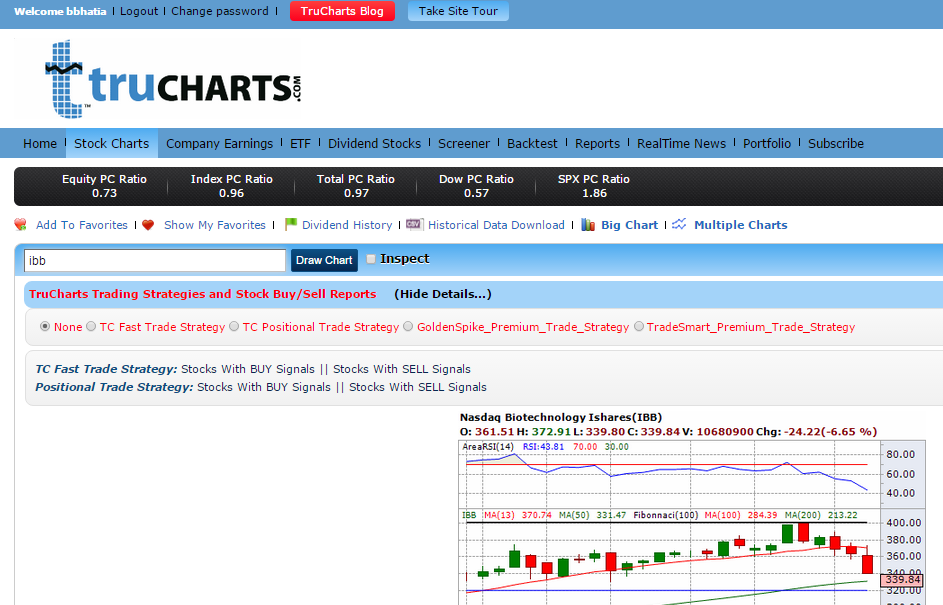
  • IBB ETF closed below 13 week SMA the week ending 8/14 for the first time in over 15 months
Well now everyone is wondering what next - what are you going to do with your portfolio - Well guess what - we are staying on the same viewpoint and thesis - Sell into rallies, take profits and short IBB (could be the best short). Markets will bounce - but these will be short lived - you can expect more volatility in the next few weeks. You will see clearly below in the charts below that major trendlines have been broken for all indices and the close below major moving averages is a big concern to us. We still like the INTC,MU,AMBA short and are shorting IBB/GILD. We were long NFLX - but with a covered call strategy. We will close half our position and wait for a better entry point. We will look to buy some index ETF on any bounce - target range for DOW is first support 16000 and then around 15000. We think PYPL could be another great short - we are short PYPL.

You can also use our BUY/SELL automated trading strategies on the stockview page to see where sell signals were generated and try to see which stocks in your portfolio are on a SELL signal - do this on weekly and daily charts for your stocks.


Here is the image of trading strategy box on the page above: You have to click to expand the box:


Here are some charts we would like to show this week - look at the trendline and averages - these are weekly charts - please look at RSI and MACD - these are headed down:


Good luck trading, take profits here and now, and sell into any rallies and wait for better entry points. DO NOT LISTEN to the talking heads on CNBC.

We love documentaries and our recommendation for this week is an amazing documentary on smart meters and why you should not allow these in your neighborhood - we live a world of tyranny and corporate corruption and power: You can see this one on AMAZON or YOUTUBE.

Trucharts Team/Founder/CEO

April 19, 2015

Was it a market Correction? Or the start of something bigger?

Market Correction or is the market going to crack here?

Markets on Friday pulled back and broke the 50d and 13d SMA from the wedge pattern we discussed in our last blog. The NASDAQ closed above its 50d SMA. Here are the charts with critical short term trendlines. We expect support for SP500 around 2048 area and for the DOW around 17450. For NASDAQ, around 4850. These will be short term critical support areas. 

There was news on new housing starts which was not good heading into the peak home buying spring season and the housing stocks - check (www.trucharts.com/stockview.aspx?TICK=LEN as an example). Then we had news from Greece and possible default, then the news of the slowdown in China growth and the stock market bubble - investors opened over 4.8M accounts in one week - think about that number 4.8M in one week - Wow!! China is experiencing the same bubbles we had in the US - stocks bubble, housing bubble and then now again stock bubble. There are bubbles brewing everywhere and now for the first time San Francisco median price crossed $1M - this is what happens when money printing machine is running non-stop.


Check the trendlines for the DOW, SP500 and NASDAQ. Watch the levels closely. We have been in a sideways consolidation pattern after the breakout in Oct of 2014. There have been breakouts, but the markets have still been in a sideways pattern. Support for DOW is around 17000, SP500 support is at 1980 area.


With the earnings season in full force there have not been too many surprises - PM raised forecasts and the tech companies have had lackluster earnings - even the forecasts have been muted. We think this is the peak of the tech cycle. 
We are looking to short XLK (www.trucharts.com/stockview.aspx?TICK=XLK
and/or SMH/IPGP (www.trucharts.com/stockview.aspx?TICK=IPGP) for the short term. 

There is a another set of earnings barrage coming next week and the week after - IBM, AAPl, TWTR, YHOO and many more - check this link on our site for the earnings calendar: http://www.trucharts.com/EarningsView.aspx?qst3=qstthisweek.

Our all long portfolio was down only 0.1% on Friday even though the markets were down over 1% each and our long/short portfolio was up 0.5% on Friday. We hedge all our positions and our TWTR position was called away on Saturday. We are long MO, USO, BIDU, TWTR. Short positions are AEM, IBB and SNDK position closed on Saturday.

Check out our special susbscription rates for full access - our features are bar none the best of the web - we are aware of other sites that charge just $35 per month for the real time news feature. Here is the link to our subscription page and our site features:

http://www.trucharts.com/truCharts_Services.aspx

http://truchartscom.blogspot.com/p/why-is-trucharts.html

Good luck trading.

Trucharts Team


April 16, 2015

Just Keep Buying; Just Keep Buying -

Trucharts.com - Mid week markets update:

SEO: BIDU stock, BIOTECH, Blog, Free Stock Charts, Hedge Fund update, Hot stocks, TWTR, MO, MACD charts

The markets are on edging on the verge of a breakout - and looks like now we have to catch up with the bubbles in China, India and Hong Kong - money printing eventually always leads to bubbles and all the central banks do not care - under the guise of slowing economies - money printing and 0% interest rates are driving an asset and stock bubble - the central banks will never admit it, even if it is staring it right in their faces - since they are scared shit to raise rates. This has led to property bubbles and stock bubbles - no one can tell now when this will end - but when it does - watch out below - this is totally unsustainable and complacency is becoming the norm - unbelievable. Bubbles after bubbles and the only folks making money from this are the VC's who love companies with no earnings going IPO and they cash in really good. 

For now our motto is: like the fish in the NEMO movie says -  

"Just keep buying, just keep buying" (like "just keep swimming..."). 

We closed CAT today. Our SNDK short worked well and we will close position today. We like ETSY here but want to wait for a week to buy. Still long BIDU & USO (doing very well). Our MO position is also doing good and as is TWTR.

Trucharts team

April 12, 2015

What will you trade this week? We like these stocks...

Trucharts.com Blog - Updated - week ending - 4/10/2015

What will you trade this week? We like these stocks...

A hectic week and now the earnings train will come to town this week. So many earnings, and we can expect, very likely a lot of surprises and disappointments - we love Wall Street - they have been lowering the earnings estimates and then it is very likely that the company will beat the lowered estimates and everyone looks like a hero - the CEO, the analyst, CNBC and news guys love surprises. Is it going to be a train wreck or a smooth ride - what is the Q2 forecast going to be like - these are the questions we need to think about.


In the background we have the Euro dropping, oil moving higher and gold also. The European markets are ripping and now the experts are predicting if the British pound is going to drop thereby driving British stock market higher - well we are in a currency war now. The Chinese and Hong Kong stock markets are on an exponential move and we had pointed to an article on our twitter post  https://www.twitter.com/trucharts) about how housewives in China are now playing in the Chinese and Hong Kong markets. This is not about to end yet - bubbles do not end abruptly - these end when everyone on the streets, including your barber, is talking about stocks. So, still a ways to go.  


Well let us see our markets - the biotech sector bounced perfectly off its 50d SMA average, as did many of the biotech stocks. The DOW, and SP500 are exhibiting a wedge pattern, which seems to be pointing that the markets may breakout here. The NASDAQ which is primarily being driven by the biotech stocks seems to be forming a right shoulder - check the charts on our home page.


Well what will you trade this week - the tech stocks - the big industrials - check the earnings calendar on our site at: (http://www.trucharts.com/EarningsView.aspx) - additionally, we show the date on the stock charts page as shown below (see red marked box on the right corner):


We are going to close our AEM position and SNDK.

Well what stocks are we going to trade: Here are our picks - be mindful of the earnings dates:

We closed BIDU and TWTR in one account - but here are the charts we like this week:

1. www.trucharts.com/stockview.aspx?TICK=CAT - earnings are on 4/23 - but the chart looks 
    excellent

2. www.trucharts.com/stockview.aspx?TICK=TWTR - earnings are on 4/28 - we like TWTR


4. www.trucharts.com/stockview.aspx?TICK=USO  - ETF - has a good chart


We had picked MYL, TEVA, LLY, ABBV, LO, RAI and M in our last blog and all of these did very well. We still like LLY (watch earnings date).

Check out our best rates for subscribing to our site at - we offer the best feature set on the web: http://www.trucharts.com/truCharts_Services.aspx

Best of luck trading.

Trucharts Team 


April 8, 2015

3 weeks and 15% return on one stock - how did we do it!!

Trucharts.com - covered call buy-write strategy BIDU stock - 


Free Stock Chart, Scans and best features of any stock charting site on the web:


How we made a 15% return in 3 weeks..

Our return of 15% on BIDU - bought stock at 205 - wrote weekly covered calls for two weeks $5.00 each - these expired worthless and then we wrote another covered call for this week for $5 - total credit was for $15.00 (for three weeks) and if stock gets called away Friday 4/10 we would end up making $1500 on ($10250) investment (50% margin). Awesome 15% return!! 

UPDATE : OUR STOCK CALLED AWAY ON FRIDAY APRIL 10.

Chart here: www.trucharts.com/stockview.aspx?TICK=BIDU

Trucharts team

April 7, 2015

Hot stock picks!!

Trucharts.com - Free Stock Charts, Scans, Dividend Stocks and more


HOT STOCK PICKS!!!

We talked about our picks in our weekly blog update and these were the HOT STOCKS we picked:

M        - Macy's Up to 68.74 - picked at 68.01 - was up to 69 this morning
TWTR  - Picked at 49.95 - Up today to 52.35 - or over $2
MO      - Picked up at 50.95 - up today to 51.90

We like LLY here.

Trucharts team

April 5, 2015

How to trade this week after the bad jobs report?

Trucharts.com - Blog - Easter Weekend - Stock Charts Free - and more.

How to trade post Easter and what to expect?

We talked about the horrendous job reports we got on Friday in our last blog update - just a reminder the reports showed 126K jobs created vs the expectations of 226K. Futures dropped on the news and the USD dropped - gold rallied and then we had oil rallying this weekend with the Saudi's raising the price of oil to the Asian nations because of demand. In addition, we have the nuclear deal with Iran and then the war going on in Yemen - this is definitely going to impact the oil price volatility. Gold is up today over $12+.

The talking heads on TV are already trying to predict the Fed's move in Q3 and we still expect that the Fed will raise rates in Q3 unless the jobs report stays below 150K. With summer coming, we expect the jobs report to improve going forward. 

Futures are down this evening (DOW futures down -115) after recovering from a 200 point drop and everyone is already trying to predict whether the Fed is going to hold off on raising rates based on one jobs report (which we think is a blip) and should resume an upward trend next month. The weather did have an impact and we suspect hiring in the oil sector was down. 

We indicated that the earnings news has not been very encouraging and we expect that the forecast for the tech sector for Q2 will not be strong. With INTC and SNDK lowering revenue forecasts, we expect numbers to be coming down in the tech sector - recommend taking profits in this sector. We are looking to short TSM and SPIL.

Since we now have to wait till the next jobs report, we expect that bonds will rally here and yields will drop and this will help the utility and dividend paying stocks to shine at least for the short term, in addition to retail/housing stocks. We like the following stocks:

MO - (we are long) www.trucharts.com/stockview.aspx?TICK=MO
RAI - www.trucharts.com/stockview.aspx?TICK=RAI
LO - www.trucharts.com/stockview.aspx?TICK=LO
M - www.trucharts.com/stockview.aspx?TICK=M
PHM - www.trucharts.com/stockview.aspx?TICK=PHM

We are short SNDK, and long USO, BIDU, MO, TWTR. We still like TWTR and you can also check out our predefined scans report on our site at www.trucharts.com/marketreports.aspx.

Also check out our special subscription deals for complete access to our site at:
www.trucharts.com/charts_services.aspx

Good luck trading.

Trucharts Team

March 18, 2015

Bought these hot stocks today - Markets Rally today

Market Rally 3/18/2018 - Thanks Ms Yellen - Greatly appreciated 

CORRECTED LINKS..IN THIS UDPATE..

Well today's Fed output (scientific term) was all but nonsense and as expected - the markets had done a classic bear trap and sucked everybody in. Our expectation was to stay net long and our picks from our blog this past week was right on the money - Euro rallied, Gold rallied, Oil rallied and the Fed will keep blowing bubbles till it learns a lesson it will never forget - till then keep partying.


We mentioned the XLU, SO, PCG, LLY and BIDU in our blog this past week and as part of our holdings - all of these stocks rallied hard today - staying long and going long more on BIDU or LLY..


Here are the charts:


www.trucharts.com/stockview.aspx?TICK=LLY


www.trucharts.com/stockview.aspx?TICK=BIDU


www.trucharts.com/stockview.aspx?TICK=XLU


www.trucharts.com/stockview.aspx?TICK=SO


www.trucharts.com/stockview.aspx?TICK=PCG


Good luck trading. 


Founder/CEO

Trucharts.com