Go Daddy Signup

Showing posts with label Subscription. Show all posts

December 28, 2014

Trucharts.com - Stocks to watch and Marlets blog week ending 12/26/2014

Trucharts.com Markets Update Blog week ending 12/26/2014:

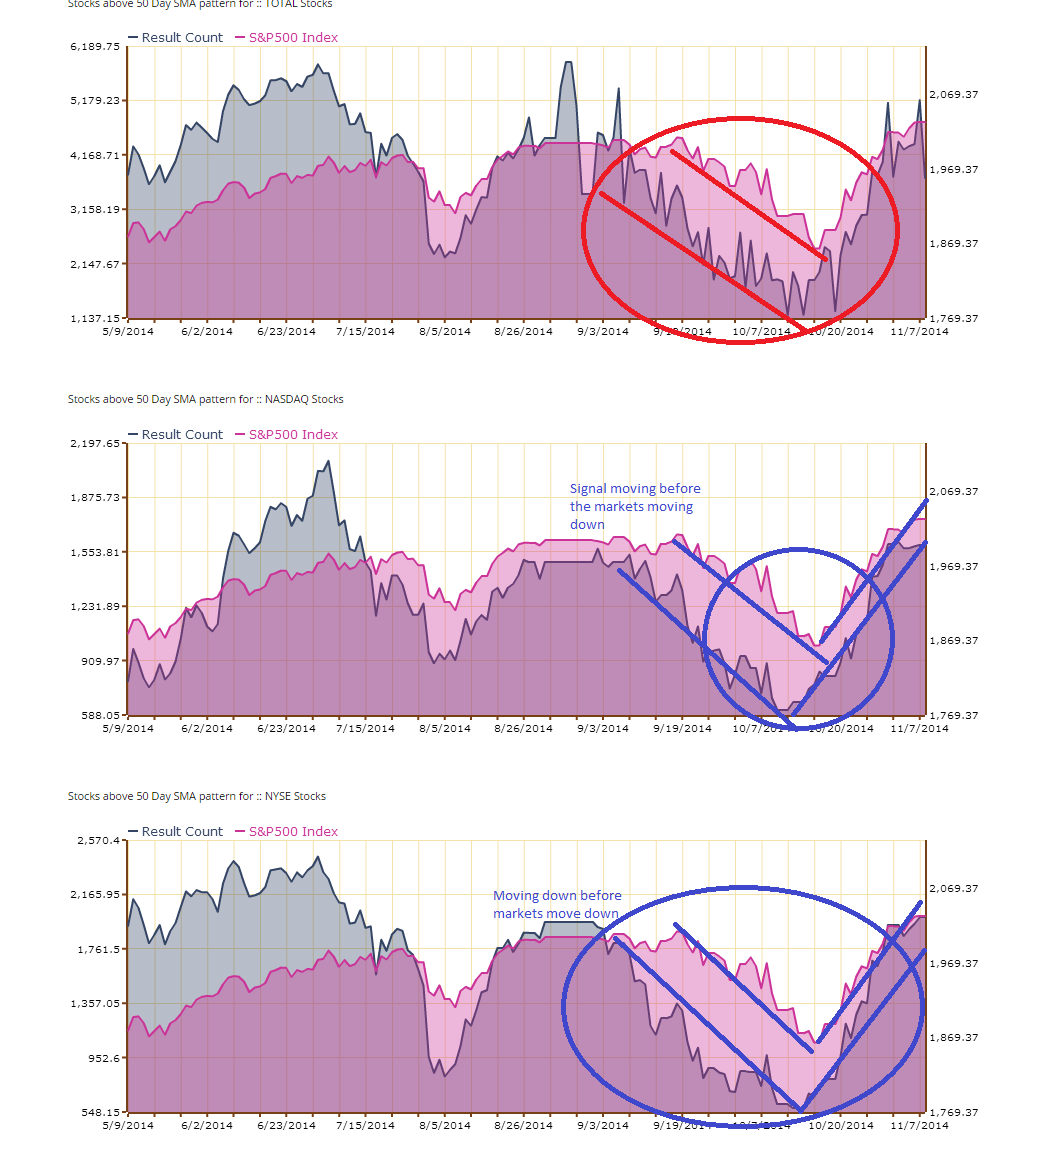
Well now we have the New Year week coming up and markets keep making record new highs. This is the highest number of new record highs hit in one year. DOW and S&P500 are still trending higher. Keep an eye on the 13 and 15 week moving averages for the stock indices and the stocks - these are very critical - you can check these on our site when you click on the week option for period on the stockview.aspx page (www.trucharts.com/stockview.aspx). There was record amount of money put into stock ETFs this past week - check this article - http://finance.yahoo.com/news/u-based-stock-funds-attract-001225961.html; There are technical indicators that look weak - like lower RSI and lower MACD on higher highs - but these are not necessarily pointing to any pullback at the present time. We are still in a seasonally strong period for equities and heading into a New Year - we do not see anything other than some minor pullbacks as we head into the earnings season. Oil seems to be trying to find a bottom here; gold bounced on Friday - we will keep an eye on this - specially due to the turmoil in the currency market in Eastern Europe (including Russia). 

We are long USO, AMKR and short AEM. Our target for gold is still 1000. There are several stocks that look strong - here are th symbols and charts -AAPL and more. We are looking to go long AAPL this week. The rules are very simple - DO NOT FIGHT THE FED and STAY WITH THE TREND. Now the Yellen put is in place and everyone does not epect any major change in the Fed' stance this comng year (till at least middle of 2015) - companies revenues are not growing based on the P/E multiples - yet these stocks keep moving higher - the average PE is being stated as low and this is happening based on significant stock buy backs being used by companies to boost their earnings and EPS. But none of these matter, since the belief is that stocks will just keep moving higher. We will stay with the trend until it breaks - (Ms Yellen (Ms Clause) will come save the day).

Here are some other symbols to watch this coming week:

For full disclosure - we are long AMKR, WSM, BIS, CYBR, K and short ALTR, DAL, YHOO, AEM (will close YHOO this week).

We added a special new feature on our site - check it out at: http://www.trucharts.com/multiplestockcharts.aspx (mulitple charts on one page)

Some good reading material: (ADDED ANOTHER GOOD ARTICLE)

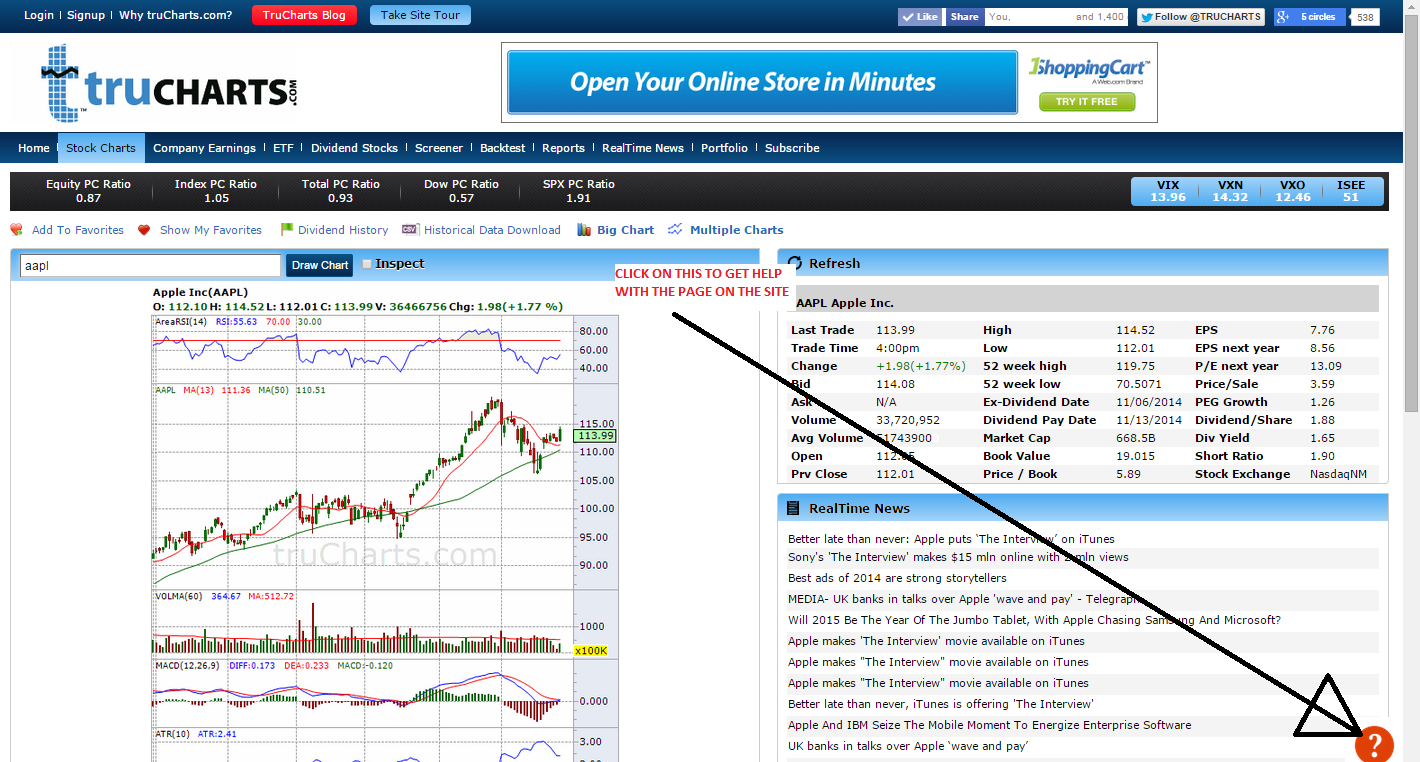
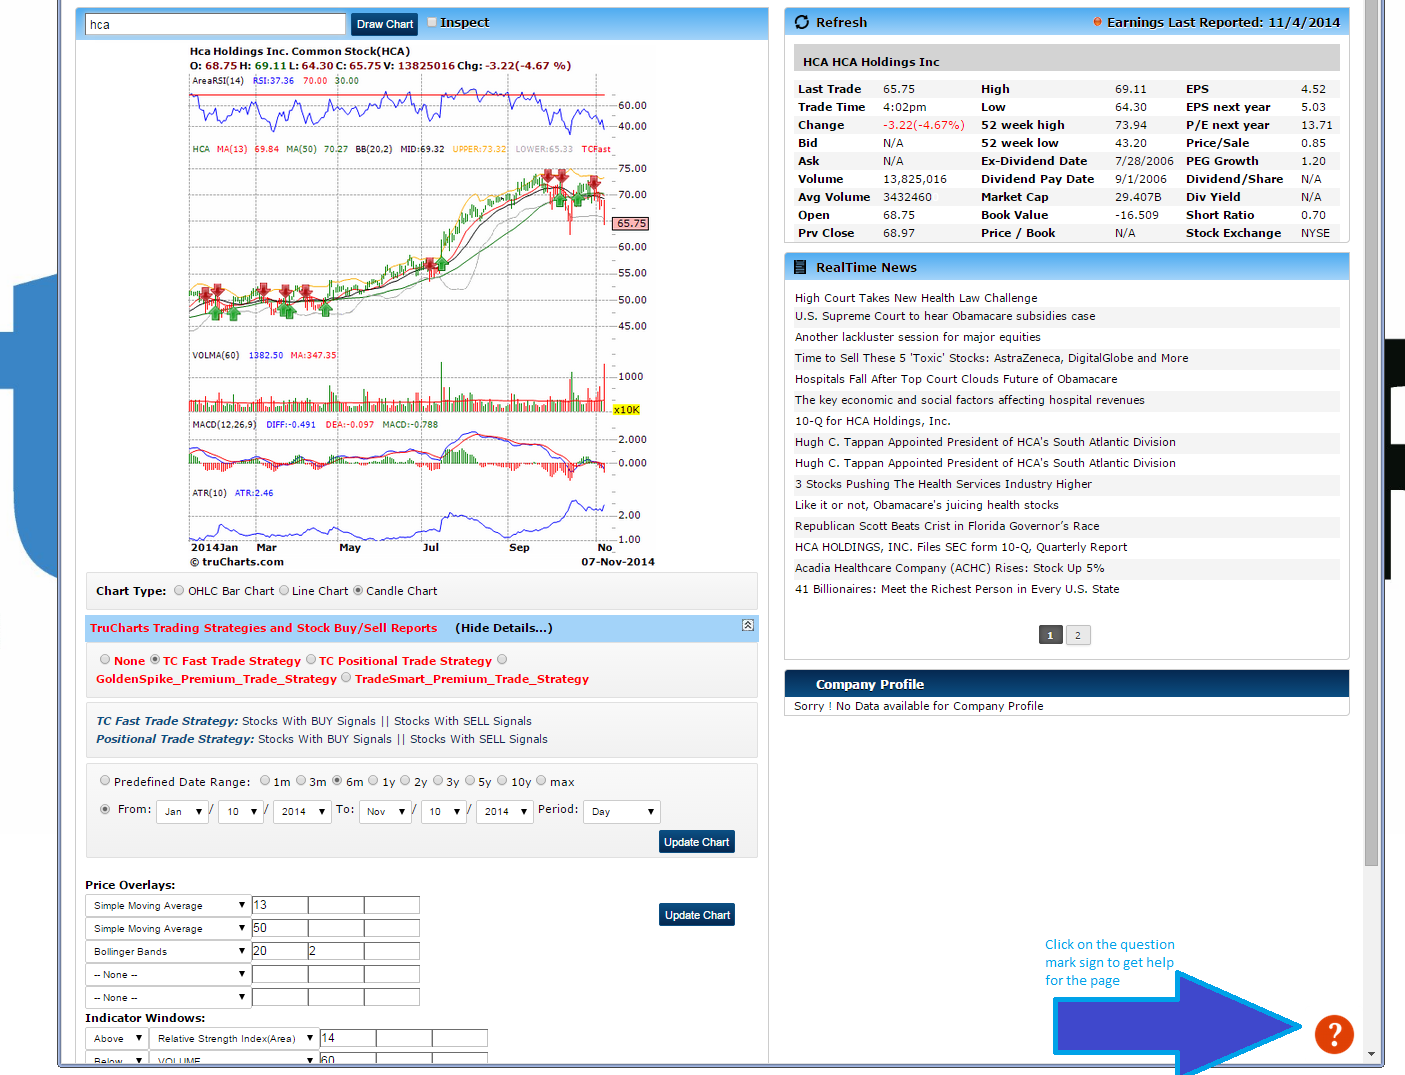
Here is the picture of how to use and access help on our website with any page.
Trucharts help


Check out our special subscription offer - no more monthly recurring fees - just $90 for the full year (50% discount)- here is the link: http://www.trucharts.com/truCharts_Services.aspx

Happy New Year to all - and good luck with trading in the New Year.

Trucharts Team

December 21, 2014

TruCharts.com – Free Stock Charts – Blog week ending 12/19/2014

Trucharts.com Blog week ending 12/19/2014

For SEO: Trucharts.com – Stock Charts Free, Stock Market, Stocks, Charting, Dividend Stocks, World Markets, Technical Analysis, Market Sentiment Charts
Merry Xmas and happy holidays to all. We are in a short week of trading this week and the fireworks were on last week after Fed Speak. We did not expect any surprises from the Fed on the raising of the Fed Funds rate, and the Fed made it a point to tell the markets that it was still ok to take risks and that drove the markets to recover over a 800 points on the DOW and 100 points on the SP500. A lot of this was driven by energy stocks and since some of the stocks had dropped over 50% – there were short covering rallies and bottom fishing and a major short squeeze. BofA Merrill Lynch downgraded several semi stocks but these did not correct as much. The SP500 and DOW look like they are still in an uptrend and our indicators are still showing a trend for the markets to mover higher – after a short consolidation period. The move this past week was massive, but the volumes in some stocks was not high. 
We like XLU (www.trucharts.com/stockview.aspx?TICK=XLU) and the utility stocks as good dividend earners. Check out the charts for SO, ED, PCG and DUK. Even the REIT’s look good and some consumer staple stocks look good. We took a position in K or Kellog (www.trucharts.com/stockview.aspx?TICK=K) and USO – we believe this has finally bottomed for the short term. Keep an eye on CAT (www.trucharts.com/stockview.aspx?TICK=CAT) – we are looking to take a position in CAT. 
We have been hurt by our short position in IBB – but have been writing puts to improve our short price. Our other positions are doing OK – Long WSM, short YHOO (plan to close Monday), DAL, AEM. We are looking to go long CYBR.
There is definitely a XMAS rally going on and we expect this to last into the New Year – until the earnings season starts. AAPL (www.trucharts.com/stockview.aspx?TICK=AAPL) still looks good technically.
We added some new features to our site this week – execiting stuff:
1. MULTIPLE SYMBOL CHARTS on one page – check this feature out at: http://www.trucharts.com/multiplestockcharts.aspx
2. ICHIMOKU cloud indicator on our stockview page and turtle trade indicator
3. Added borders to our charts
Check the features out and also our page: http://truchartscom.blogspot.com/p/why-is-trucharts.html
In addition, we want everyone to take advantage of avoiding monthly recurring fees  and sign up NOW for one very low annual membership for full access for just $90/year – a 50% discount to the annual membership fees and this gives you real time categorized news and complete access to all of the site including dividend stocks etc.
Again – Best wishes for the holidays to all and a Happy New Year and good luck trading.

TruCharts Team

December 15, 2014

Brief Update on Markets 12/15/2014


Free Stock Charts/Scans/Stock Screener at Trucharts.com - 


We talked about gold pulling back and being short IBB - both of these are moving down and the commodity complex breakdown is going to affect gold and gold miners. Russian ruble has completely crashed and is now worse than the Indian Rupee. Amazing what US political power can do. Short AEM, GM and IBB, long BIS and WSM.


Markets were up and everyone was getting excited this morning. Then we had a pullback and we need to wait and see if the markets consolidate here.

Trucharts team

December 14, 2014

Trucharts.com Blog week ending 12/12/2014

Trucharts.com Blog Week ending 12/12/2014


We expected the markets to hit 18000 for the DOW and 2100 for the S&P500. It came close but did not touch these milestones. We stated that the markets were looking extended and that the risk was high - that scenario played itself out this past week. The breakdown in oil and the commodity complex was not surprising. We expect oil to hit between 50 and 55 - that would be more than a 50% correction and we expect some bottoming in that range. The commodity 15 year bull cycle may be coming to an end. Stocks looked extremely extended and one of our sentiment charts was showing that a puulback was imminent. Check out this chart which had predicted prior pullbacks - it is the chart of the stocks below their 50d SMA vs S&P500 - check this chart below:


You can see in the chart above how the trend for the stocks above 50d SMA is trending down even when the market is hitting new highs. This is evident in both the charts for stocks on the NYSE and NASDAQ. It does not appear that this has bottomed. We should keep an eye on this indicator on ur reports page under "Charts" at .

We expect volatility to be up this week and the S&P to touch the 50D SMA at 2000 and we have to see if the buyers jump in. The DIA has it's 50D SMA at 172.4 - we would like to see if this bounces back. The megaphone pattern in the indices is lookign evident - but then we have to wait and watch - if that does play out then the S&P500 has to break below it's previous low on the prior corrction in October. 

Fortunately for our portfolio, we followed our charting buy/sell signal strategies and closed positions in SDRL (down over 50% from our sell price), RIG, USO (all oil related). We stated shorting GM - still looks like a good short - in addition we had shown the chart for FCX as short in our last blog. We are short ALTR, IBB, DAL, YHOO and long BIS, WSM. We have hedged our positions with puts and calls. Although we see opportunity oin shorting AA - we will wait and watch since we are over exposed to shorts currently. 

Good luck trading next week.

Trucharts team 


November 16, 2014

Trucharts.com Stocks to Watch and Markets Blog Update Week ending 11/14/2014

Trucharts.com Markets Blog Update Week ending 11/14/2014

Markets have been vacillating and staying within a very tight range and always moving higher into the close. The VIX gets slammed at the end of the day and the markets bounce back – even though we are seeing narrow breadth and narrow leadership in the stocks driving the markets. We have ramped very fast from the correction in October and the markets appear to be topping out here. Individual stocks have been seeing some movement – but no sector other than the transports stands out. There is no question that this is definitely a trader’s dream come true – stocks move quite nicely and smart traders (day traders and short term traders) are taking advantage of this volatility in the stocks. Take a look at the stocks like Z, AMZN, BIDU, TSLA and many more momo stocks.
Our sentiment indicators are showing that the markets will stay within a tight range and, as we stated in our earlier blogs, markets will not correct into the Thanksgiving holidays. We can expect volatility but no major moves (unless there are black swan events). The GOP is going to take some time off from their victory in the mid-term elections and come back with a fresh agenda in January and let the President take it easy for the holidays.
The move in gold this Friday looks like a BULL trap – be mindful – the trend is still down and the move in the gold miners also was not on convincing volume. We would sell into the gold rally – the move was due to the coming referendum in Switzerland for the repatriation of their gold. We do not expect this to pass, and the day the this does not pass – watch gold – we think it will drop over $100 (just our speculation). We are short AEM and will stay short. Our prediction for gold price is still at least $1000.
Our IBB short is still in play and we expect the BIOTECH unwinding to start – it started on Friday. Mutual Funds will start to take profits in this sector and will try to show good performance into the end of the year.
The China stock market is coming off a bottom and since the link with the Hong Kong stock exchange, the China ADRs have been moving up quite well.  Surprisingly, we missed BIDU but we have been long JRJC (www.trucharts.com/stockview.aspx?TICK=JRJC) and are looking for stocks in the China ADRs for good buy candidates – we like WUBA – here is the chart – check the weekly and daily chart – (www.trucharts.com/stockview.aspx?TICK=WUBA). Check the weekly technicals:
Here is the chart for reference:
WUBA Stock Chart
We have a special offer for the holidays on our yearly subscription – 50% discount – check this at the following link:
The following is the list of stocks we will be watching this week:
Z                    - www.trucharts.com/stockview.aspx?TICK=Z
TRLA              - www.trucharts.com/stockview.aspx?TICK=TRLA
CYBR, WIFI, TWTR.
We are long CYBR. We closed our USO position at a loss - we were stopped out of the position. Always remember capital preservation is key.
Here is the Help file image for our real time news page:
Stock Market Real time News - Trucharts.com
Trucharts.com Realtime News Help

November 10, 2014

Trucharts.com - Stockwatch List

Turcharts.com - Stocks to Watch List


Here is our list of stocks to watch for this week:

NSC    - Up today $3 - our buy signal triggered on Friday and shown in our blog
ABBV  - Up today $2
XOP    - down - but we think consolidating
T        - moving higher
MO     - hitting new highs
JRJC   - China allowing foreign investors access to China markets
USO    - Consolidating - watching closely to see breakdown or move up
WSM   - Watch closely - earnings expected 11/19

Trucharts Team

November 9, 2014

Trucharts.com - Stocks to watch week of 11/10 and Blog Update week ending 11/7/2014

Trucharts.com - Blog and markets Update for week ending 11/7/2014

Mid-term elections done - well the GOP won and now we have to see their agenda. Employment news - which was so-so and with that we had, oil rallying after being trounced, gold rallying on Friday after hitting new lows and the gold miners rising.  Markets hitting new highs and VIX dropping (as we had been indicating for quite some time) - we still expect the VIX to drop and markets to consolidate their gains here and breadth is narrow. Markets are heading into a strong cycle - end of the year when holiday season starts and into the new year.  We do expect to see some pullback from this big move, but move to new highs is still in the cards. With the Fed staying put on interest rates, we do not expect any type of major pullback in the markets. The Fed will not raise rates till next year - and that will drive the markets' direction. With no other avenues to make good returns, investors have no choice but to put the money into markets and now the BOJ announced a round of stimulus to put money into stocks - that just gives the markets more impetus to move higher.  Pockets of strength still exits and we need to take advantage of these.
We are looking to the following sectors and stocks next week. Oil and energy stocks/ETFs, gold miners for short term trades.
We have added a very helpful feature on our site to help and assist our users on how to use each page and a description of each field on the page. Please check this image below for this feature - it is on each page of our site now (except home page which is under re-design).
help_photo
Here we wanted to show below how the sentiment charts from our site predicted this massive move up and the correction we experienced 3-4 weeks ago in the markets - note the drop in the stocks above 50d SMA before the markets actually went down and then the rise in stocks above 50d SMA before the move up in the markets. The signals are very clear prior to the market moves - we have highlighted these with the trend lines. You can see clearly that we are at a top and a sideways market for the next few weeks and possible pullback prior to thanksgiving.  As you can see the stocks above 50d SMA is moving down and we are in a topping mode for the markets. We have several such indicators for all the reports we generate on our reports page:
Sentiment Signal prior to market moves
Here is our list of stocks to watch for the coming week:
Buy SIgnal: www.trucharts.com/stockview.aspx?TICK=XOP
www.trucharts.com/stockview.aspx?TICK=NSC
www.trucharts.com/stockview.aspx?TICK=TGT 
www.trucharts.com/stockview.aspx?TICK=DO (watch)
www.trucharts.com/stockview.aspx?TICK=ETP
www.trucharts.com/stockview.aspx?TICK=CNQ (short term trade)
Good luck trading.
Here is the udpate from our hedge fund manager for his performance from last week (cumulative return for a $50000 account):


November 4, 2014

Trucharts.com - Help file for REPORTS page - Check this out

TRUCHARTS.com - REPORTS page Help files


Stock Charts - Trucharts.com - Help file for REPORTS page - Here below today we have attached two pcitures showing the details for our reports page and the explanation of the fields - you can also see our mouseover feature  - you can access the page at: www.trucharts.com/marketreports.aspx.


November 3, 2014

Trucharts Special Promotion

Trucharts.com SPECIAL PROMOTION

CHECK IT OUT - Our First Promotion


Check our new special subscription promotion - a 50% discount:

http://www.trucharts.com/truCharts_Services.aspx

Basically you get 18 months of service for 12 months payment.

Trucharts team