Go Daddy Signup

Showing posts with label BIOTECH. Show all posts

February 25, 2015

Stock Market update - Closing 2/25/2015

Stock Market update - Closing 2/25/2015


Free Stock Charts - Trucharts.com - 

On our watchlist today were USO (up), ANGI, LLY, and BOX. ANGI is consolidating for a move up as is BOX. BOX is very risky. We are long all these symbols.

Markets ended almost flat for the day after Janet Yellen's testimony. Gold was up slightly and oil was up today. We think there will be some pullback in thae markets or some consolidation. We still expect NASDAQ to reach and breach the 5000 mark - thanks to BIOTECH sector stocks and the bubble in internet stocks. 

Oil is consolidating here and trying to form a bottom - we expect thsi to move up into summer. 

Watch USO and OIL etf's closely.

Trucharts team

January 15, 2015

Trucharts.com - Free stocks and Scans - Markets Update and comments - 01/15/2015


Another down day and we stated in our blog and during the weekly commentary the up move looked like a bull trap and that the markets looked precarious. Earnings are not coming in as expected - and the high expectations were reflected in the high valuations and stock prices - it was like there would be no end in sight - markets were moving up on low volume into the end of the year. 

Stocks that do not look good are BBY (Best buy), INTC (Intel), FB (Facebook) - we shorted FB today. We went long gold miners today and we stated that these were looking strong over the weekend - the gold move up was primarily due to the down move for the USD and then the SNB announcement that the Swiss Franc peg to the Euro was no longer in play - that drove gold even higher - this tells us that the Euro is doomed and it will go to par with the USD. A lot of hedge funds exploded today due to the short position in the Swiss franc. 

We showed several stocks on our blog that exhibited weak technicals and were flashing sell signals in our weekly commentary on g+ and twitter (@trucharts). We are short IBB, GM, F, DAL and AEM. Long ANV, WSM, USO, LINE, K and BIS.

Click here to access the charts on our site: www.trucharts.com/stockview.aspx

The markets for the short term have not bottomed yet and we should see some technical weakness into the earnings barrage next week. We would short BBY here and our next pick is LAD - we think the auto cycle has peaked and any stock dealing with the auto market is a short - especially dealers and manufacturers (GM, F are examples of stocks we are short). Here is the chart for LAD and it flashed a red sell signal yesterday:

Use our site for auto buy and sell signal strategy. You can save and make money using this excellent proprietary trading indicator. 


January 13, 2015

What a day!!! - closing remarks 1/13/2014

Well it sure felt like Friday the 13th today. Markets were up and then pulled back completely. We think it was a bull trap and people are very concerned about the upcoming earnings reports and forward guidance. With oil dropping and the commodity sector (at least for now except gold) falling - looks like there maybe some rough riding here. These type of moves happen when there is tug of war between the bears and the bulls. TIF (Tiffany got massacred yesterday) - Crappy stock SNDK got killed - they were getting the benefit of a bull market and we think the semiconductor run maybe over. Please take profits in this sector until the 2nd half of the year comes around. Technically, today was a bearish day - see chart below for DIA and SPY. You will see lower RSI , lower MACD and the DIA/SPY closed 50d SMA. ALmost looks like a bearish wedge pattern.

We think oil has reached the bottom of its range - we will watch it here carefully and try to establish a position in USO.

We hope to see some good results from the retailers - we will keep an eye on that.
We will close our ABBV position tomorrow - should have closed it today.

We are long AMKR,WSM,K,CYBR,USO and LINE. Short GM,F,AEM,DAL,IBB. We always hedge our portfolio with options and not be all long or all short.


Check out our site and you can clearly see our auto buy/sell signals for your stocks.
GPRO and MU were on the sell signal list 4-5 days ago.

Trucharts team

December 15, 2014

Brief Update on Markets 12/15/2014


Free Stock Charts/Scans/Stock Screener at Trucharts.com - 


We talked about gold pulling back and being short IBB - both of these are moving down and the commodity complex breakdown is going to affect gold and gold miners. Russian ruble has completely crashed and is now worse than the Indian Rupee. Amazing what US political power can do. Short AEM, GM and IBB, long BIS and WSM.


Markets were up and everyone was getting excited this morning. Then we had a pullback and we need to wait and see if the markets consolidate here.

Trucharts team

November 23, 2014

Trucharts.com – Weekly blog update and Stocks to Watch week ending 11/21/2014

Weekly Blog Update – Week ending 11/21/2014

Another week and another set of new highs in all the indices – PBOC cutting rates set off a rally in the markets Friday and the world central banks pumping heavy liquidity is driving markets higher.  The US markets are the sole investment for the world investors for the best returns. Stock markets and stocks are trending higher without a hint of any correction or pullback. We stated that the trend was higher going into the holiday season, and we expect that to continue or for the markets to be range bound.  There was a breakout in the S&P500 and the major indices this past week and even though the markets appear over bought – this can last into the New Year.  The pattern on the chart indicates higher highs are coming and there is major complacency in the markets.  But typically we do not expect to see any major issues due to the strong Q4 tendencies.  Certain sectors were sparked due to the PBOC cut – like the commodity sector, machinery sector and the emerging market ETFs.
We are seeing oil bouncing back, and we will short the airline stocks this week for a short term trade.  Gold bounced back last week but the trend is still down.  We will be watching the gold and oil sector this week. Some of the ETFs we mentioned OIL and USO are coming off lows and the energy stocks, which were hammered recently are bouncing back. Keep an eye on these oil sector stocks – NOV, NBR, DO, CVX and many others in the energy complex.
We are long WSM, CYBR, YELP and short AEM, IBB and waiting to short the airlines sector this week.  This will be a short trading week but expect consolidation and range bound markets.  Here are some charts to ponder over this week. You can see clearly the UPRO (long SP500 ETF) is very overbought and the DAL chart is breaking down.
Charts for the week:


November 19, 2014

Trucharts.com midday update Stock Markets

Trucharts.com midday update Stock Markets


We stated that the markets will be meandering within a range here.  We saw a breakout yesterday and we need to see follow through.  FOMC minutes were released today and that is affecting the markets.  See article below.

Best Stock Charts and Scans - TruCharts.com -

Our AEM short is still looking good.  We are long YELP - but we had written covered calls on that position - it is down - but we will hold till December.  Still short IBB and biotech.

Looking to short LUV and airline stocks.


Our pick Z and TRLA from the weekend blog did well these past two days - check the charts on our site.

www.trucharts.com/stockview.aspx?TICK=Z

www.trucharts.com/stockview.aspx?TICK=TRLA

Also check out the FOMC minutes brief at:

http://www.zerohedge.com/news/2014-11-19/fomc-minutes-show-deflation-wary-fed-not-worried-about-global-growth


TruCHARTS team

November 18, 2014

TruCharts.com Market closing update 11/18/2014

TruCharts.com Market closing update 11/18/2014


Markets pushed higher all day today after the housing report and general bullishness heading into the holidays.  S&P 500 crossed 2050 and we stated last week in our blog that the markets are trending higher and the ISEE ratio was indicating a higher market for this week.  We think the DJIA is headed to 18000 and a melt up - stocks like HD - even after reporting so-so earnings are not getting hammered - that tells us that bad news is not affecting stocks - this is typical of bull market behavior - exponential charts and low VIX along with general bullishness from the sentiment reports like AAII and investor sentiment numbers.  

Gold moved higher this week - again related to the SWISS referendum - and the dollar dropping.  Still not a convinving enough rally to buy gold here.  We expect it to pullback soon.  

Tech stocks  such as ASML are breaking out, airline stocks are also doing well (oil price drop).  This is definitely a trader's dream come true.  

Biotech stocks moved higher today - but we think there is definitely topping action in this sector due to the volatility in the price movement - we typically see this type of price action at tops.

Check out our BUY/SELL signal end of day reports and also the BULLISH MACD crossover reports for longs and the opposite for sell/short signals.

Check out our very good sell signal using the trucharts.com buy/sell strategy for FCX. Looks really good if you had shorted FCX around 38 or so.

Trucharts.com FCX Sell Signal


November 17, 2014

Stock update for Monday AM


Please check our picks from this weekend's blog - Z and TRLA and WUBA all up. Z is up 5+ and TRLA is up 2+ and this was all because of our market scan reports.

Keep an eye on the biotech sector - we stated in our weekly blog - this sector is ready for a major pullback and setup for profit taking. LONG BIS.

We are long CYBR, short IBB and AEM.

Trucharts Team

November 14, 2014

Trucharts.com Biotech sector Update


Stock Charts - Free - Trucharts.com - We have been short IBB and biotech sector - check these stocks out today BIIB - down 14 and we think this sector is overbought and ripe for shorting now.  Long BIS/Short IBB.

November 13, 2014

Trucharts Positions Update

We are still short IBB (BIOTECH ETF) - we expect there to be profit taking in this sector into the end of the year by mutual funds which are up in this sector for 2014 with very good gains. Long CYBR, short IBB.
Closed USO this morning at a loss.  We had a stop limit of 29 and we were stopped out of this postion. We went long CYBR this morning.
Trucharts team

October 19, 2014

Trucharts.com end of weekly blog update - 10/17/2014

Trucharts.com end of week Blog update 10/17/2014

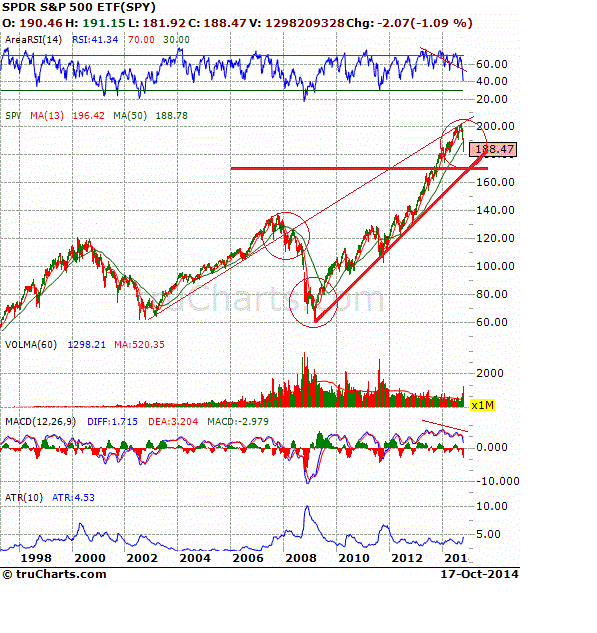
What a week of market gyrations.  It had our head spinning.  We were expecting volatility – but this was nothing we have experienced in the past two years – since the markets (like we stated before) have been going up in a straight line.  The correlation between the Fed balance sheet and the markets has been moving in tandem.  And then the Fed speaks anytime the markets drop – because obviously all the Wall Street guys are concerned about their portfolios dropping and how this will impact the average investor.  Fed governor Bullard spoke and then we had some other Fed governors speak – as soon as that happened the markets jumped and bounced.  It is like a scripted movie – predictable. Bullard (non-voting member fo FOMC) stated that the Fed should keep the bond buying active – wow!! As if the Fed balance sheet is not big enough yet.  It is $4T – yes 4 TRILLION and that has created a bubble in stocks, real estate and every asset.  Bonds had moved higher into this volatility and the VIX spiked to a high of 31+ and then settled the week at 21.99. We expect the VIX to pull back and bring some sense to back for some time into the markets.  There are some interesting charts we have shown below and with comments and trendlines indicated.  We are short IBB still and GM.  We expect NFLX to pull back and since we have earnings coming up from AAPL and many big names next week – we would like to stay on the sidelines and keep our powder dry.  We went long USO even though we think the correction in the OIL/energy sector is not over.  Gold did bounce but the long term chart looks weak.  Gold miners are getting slaughtered.
We have added one of our unique sentiment indicator charts at link:  http://www.trucharts.com/MarketSentiment_ISEE.aspx
This is of VIX vs SPY500 and you can see clearly how the VIX spiked significantly last week.
We have added the charts for LUV (Southwest airlines) – position closed last week.  DAL short closed last week – even though we may retake the short positions in these later.  Our SNDK profit was 150% – Oct 92.5 puts – we bought at $4 and it closed and sold for $10 on Friday expiration.
XLE chart shows breakdown in the energy sector.
QQQ bounced exactly off the 50 week average – see chart below.
The volatility did allow day traders to take advantage of the daily moves in the markets/stocks.  One of our fund manager friend who manages a S&P futures fund made the highest return and the return for the week was a whopping 17% and the YTD  return has been 64% with a hit ratio of 96.5%.
If you are interested in discussing this with our hedge fund manager – please contact us at support@trucharts.com and or at bbhatia@trucharts.com.  Please keep in mind that the minimum investment required is $50K or $100K.  
Here is the weekly return chart for past 32 weeks.  As you can see the return is low when volatility is low – but none the less positive.


Best of luck trading next week;
Trucharts team

October 15, 2014

Market Update - 10/15/2014 - AM Update


Stock Charts/Scans FREE - Trucharts.com - We had a sharp selloff and a spike in volatility.  Retail sales did not look very good.  

Watch NFLX stock - very expensive and ready to pullback.  We are still short the biotech sector and GM/HPQ. Long BIS, ED, T - we like the utility stocks here since the yields on the treasury bonds are pulling back.

NFLX Chart: Check the weekly pullback in RSI and MACD indicators.


Check out our site features at - our page - Why Trucharts.com? 
http://truchartscom.blogspot.com/p/why-is-trucharts.html

October 14, 2014

Stock Charts Free - Trucharts.com - IBB chart update

TruCharts.com Blog Update for ETF IBB

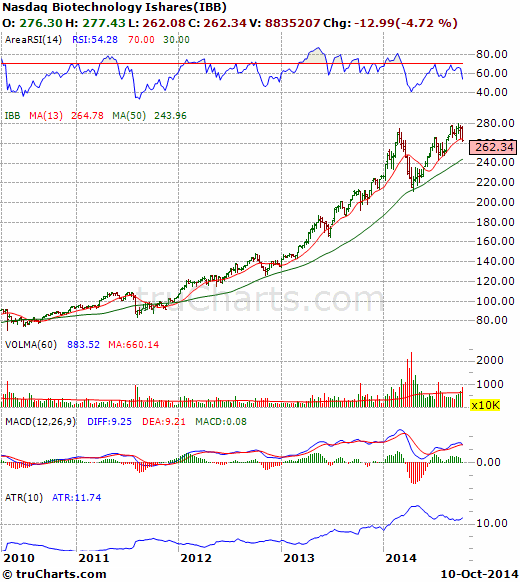
Check out this chart for IBB - next support is at 50 week moving average.  Note the RSI and MACD for weekly -  If it breaks and closed below the 50 week - next support is at 220.


October 12, 2014

Stock Charts - Trucharts.com - Blog Update ending 10/10/14

Trucharts.com - Blog Update week ending 10/10/2014


Well what a volatile week this was.  Markets ended on a weak note on Friday.  We stated last week that volatility was high and that it would pull back - well we did get a pullback on Monday but then it moved up significantly by Friday.  There were huge moves in the markets and in oil.  Oil closed below the $85 mark.  Many oil drillers and stocks related to the oil industry are crashing and we think this well affect the Texas economy significantly.  Last week we showed some very good charts on the markets - we indicated that there was underlying technical weakness even as the markets were moving higher.  The RSI and MACD were weak and this is where techncial analysis becomes very useful. We believe that there is incessant selling in the oil stocks due to margin calls.  Just check the stock charts for APC, CLR, APA, HAL and many more.

The gold miner stocks are also getting crushed.  We still like gold - we suspect it has bottomed here for a short time - but the long term trend is showing a possible price target of $1000.  We will keep a close eye on this.
Last week there was news from Microchip (MCHP) that affected the semiconductor sector.  We had been short SNDK and SIMO.  We think this is real weakness and expect this to continue through into 2015.  Check the charts for NXPI, AVGO, LLTC, XLNX, LRCX, KLAC and many more in this sector at: www.trucharts.com/stockview.aspx.  This sector is in major correction mode as is the NASDAQ.

We indicated that we would be shorting HPQ, SNDK, GM and we took short positions in these stocks.

Now for the next sector which we have been indicating is in bubble mode and should see a correction or major pullback - we are long BIS and short IBB.  We have been showing these charts for the past 2 weeks.  Here is the chart for IBB and BIB - note the close belowe the 13 week average for the first time in over 12 weeks - also note the technical weakness in the RSI/MACD and volume. The next support is at the 50 week moving average.
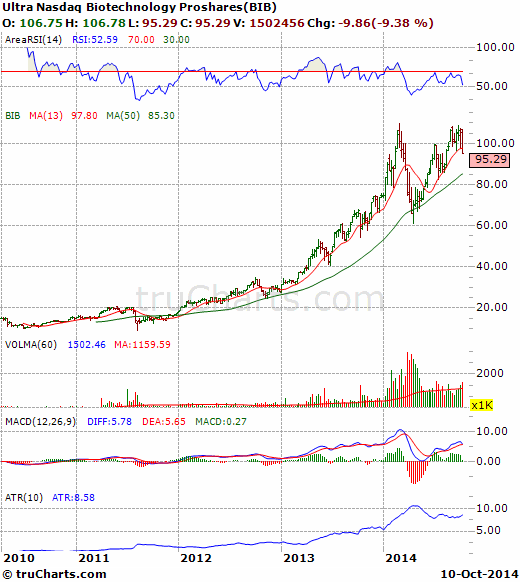
BIB stock chart
BIB weekly close
Stock Chart IBB weekly
IBB weekly chart

October 11, 2014

Brief update - TruCharts.com - Week ending 10/14/2014

Brief Update - Week ending - 10/10/2014 - Stock Charts/Stock Scans

Check this chart for biotech ETF IBB - closed below 13 week moving average for 1st time in around 12 weeks. This is a major short - see the MACD and RSI - close your biotech stock positions - this sector is going down - short IBB and biotech sector. We are short GM/HPQ/SNDK and biotech sector.  Next test level will be the 50 week moving average - around $244.  Watch this level closely.

Here is the chart:

IBB ETF - Weekly Chart

October 10, 2014

Stock Charts - Trucharts.com - Blog update 10/10/14

Free Stock Charts - Trucharts.com -  We have been saying sell into rallies and sell biotech stocks.  We are short IBB and GM/HPQ.  Expect this downdraft to continue.  Take profits now. 

September 4, 2014

TruCharts.com:  Update 9/4/2014


Stock Charts: Tecnhical Analysis:  So we talked about closing of our BP position last week and that was the correct call.  In addition, we have been saying take profits in the BIOTECH sector stocks and these are pulling back today.  We would continue to take profits here.

TruCharts team

September 3, 2014

truCharts.com; Stock Charts update 9/3/2014

Stock Charts - truCharts.com - Update 9/3/2014


The DJIA and the SPY are moving within a very tight range for the last few days since the close above 2000.  There may still be legs in this rally, but we advise taking profits in at least half of your positions and watch oil closely today - coming off an oversold condition - check USO and OIL - we still like these from a technical analysis point of view.  BIOTECH rally is running out of steam here - very overpriced sector and over hyped.  We will go long USO (full disclosure) end of day today and are long TUBE, BIS and YHOO.  We will publish a technical update on the indices this week and show some technical divergences.

TruCharts team
www.trucharts.com