Go Daddy Signup

Showing posts with label Stock Charts Free. Show all posts

February 15, 2015

Trucharts.com Blog - week ending 2/13/2015 and Stocks to Watch

Trucharts.com Blog week ending 2/13/2015

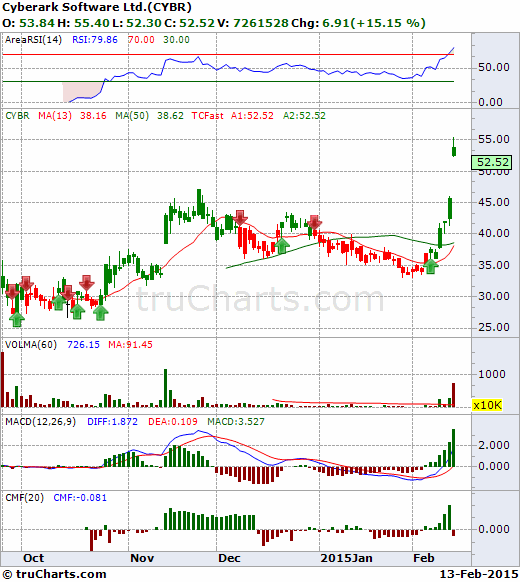
Happy Valentine’s day to all and after a short travel hiatus, we are back to writing our blog. Due to blogging restrictions in China, we were unable to post to our G+, FB and blogger/WP. It feels weird when you cannot blog about just something simple as stocks. Anyway, it has been an exciting week after what we call a consolidation period in the markets. The S&P,NASDAQ and the DOW all hit an all time high – we were expecting the breakout based on the wedge pattern/descending triangle pattern that started in Nov. We expect this to move to last based on the recent earnings and the oil sector bouncing back. Gold pulled back and we expect gold to move down – we think the move up was due to the Chinese New Year. The Greek crisis is just noise and we do not expect this to impact the markets. Oil is in a bottoming phase and we will watch this closely – our picks LINE, USO and OIL jumped very nicely (over 30% for LINE and OIL etf), our GM short and F short will be rolled over to next month. We expect this to be a peak year for auto sales. Our pick CYBR did very well as did TWTR – both of these are up over 40% CYBR and 20% TWTR since our calls and check out the buy signal for CYBR on our buy/sell strategy chart below:

Check the Chaikin money flow Index on the bottom of the chart – it went negative when the stock gapped up on Friday. Based on our technical analysis, we would expect the stock to pull back/consolidate and make a move higher. The earnings were announced on Thursday after the close and the company crushed the earnings and guided higher.
CYBR Stock Chart

CYBR _ WITH BUY/SELL SIGNALS

TWTR also reported good earnings and that moved higher and we are still expecting a move higher in TWTR. 

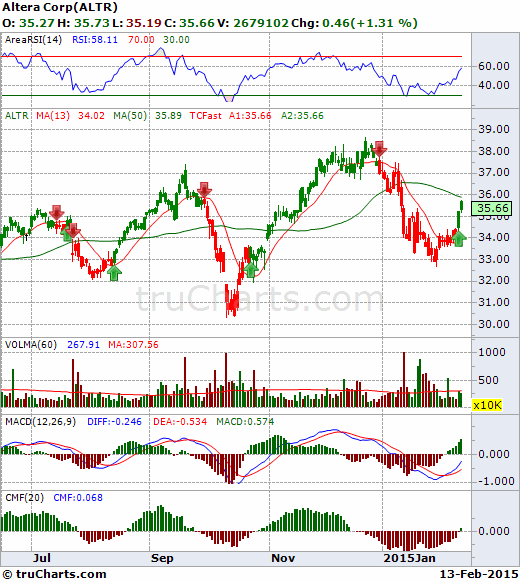
We went long ALTR based on the technicals. Here is the chart for ALTR. We will exit the position this week around 36.25 or better.

ALTR Stock Chart
We went long AMKR, are long USO/LINE and are watching the following stocks closely next week:

http://www.trucharts.com/stockview.aspx?TICK=VFC (which went buy signal right before the gap up)
Markets are closed for President’s day – Monday. Good luck trading and check out our multiple charts feature and also our real time categorized news feature.

We closed our position in K (Kellogg) right before it gapped down on Friday – looks like people are not eating enough cereal!!

Our call on DAL short was right on the money - we closed that position this week.

Trucharts Founder

January 15, 2015

Trucharts.com - Free stocks and Scans - Markets Update and comments - 01/15/2015


Another down day and we stated in our blog and during the weekly commentary the up move looked like a bull trap and that the markets looked precarious. Earnings are not coming in as expected - and the high expectations were reflected in the high valuations and stock prices - it was like there would be no end in sight - markets were moving up on low volume into the end of the year. 

Stocks that do not look good are BBY (Best buy), INTC (Intel), FB (Facebook) - we shorted FB today. We went long gold miners today and we stated that these were looking strong over the weekend - the gold move up was primarily due to the down move for the USD and then the SNB announcement that the Swiss Franc peg to the Euro was no longer in play - that drove gold even higher - this tells us that the Euro is doomed and it will go to par with the USD. A lot of hedge funds exploded today due to the short position in the Swiss franc. 

We showed several stocks on our blog that exhibited weak technicals and were flashing sell signals in our weekly commentary on g+ and twitter (@trucharts). We are short IBB, GM, F, DAL and AEM. Long ANV, WSM, USO, LINE, K and BIS.

Click here to access the charts on our site: www.trucharts.com/stockview.aspx

The markets for the short term have not bottomed yet and we should see some technical weakness into the earnings barrage next week. We would short BBY here and our next pick is LAD - we think the auto cycle has peaked and any stock dealing with the auto market is a short - especially dealers and manufacturers (GM, F are examples of stocks we are short). Here is the chart for LAD and it flashed a red sell signal yesterday:

Use our site for auto buy and sell signal strategy. You can save and make money using this excellent proprietary trading indicator. 


January 8, 2015

Stocks to watch - Trucharts.com - Update for 1/8/2015:

Stocks to watch - Trucharts.com - Update for 1/8/2015:

Stock Charts Free, Charting and Scans - Trucharts.com: Stocks to watch for 1/9/2015:

Here are our top picks for trading on 1/9/2015: TWTR, AAPL, UNH, FSL

We expect the markets to break its old highs - it is like party of 1999. Election year before 2000 elections - Fed on hold and valuations going through the roof. Just watch what what you buy - looks like consumer staples and retail are looking good. Even the healthcare insurance companies are looking strong. Looks like OIL is bottoming - watch USO, LINE, OIL, shorting SCO. We are long USO and LINE and looking to go long TWTR.


Check this report on our site: http://www.trucharts.com/FilteredStocks.aspx?ConditionId=77990,77991,77992

This is a list of stocks screened for being above $2 today.

Trucharts Team

January 4, 2015

Trucharts.com Weekly blog - stocks to watch week ending 01/02/2015

Trucharts.com Weekly blog week ending 01/02/2015


For SEO: Stock Charts Free, Charting, Stock Market, Technical Analysis, Stock Blog, Stock Buy and Sell Signals.

Happy New Year 2015 to all:

Market Stats:                     DOW 17832.99; S&P500: 2058.20; NASDAQ: 4726.81

NYSEAmexNASDAQ
New Highs55564
New Lows23531
Up Volume1,317,747,081 (49%)54,149,125 (72%)640,070,736 (47%)
Down Volume1,361,184,794 (50%)18,108,068 (24%)714,790,713 (52%)
Unchanged Volume31,963,947 (1%)2,449,256 (3%)11,961,935 (1%)
Total Volume2,710,895,82274,706,4491,366,823,384

New Year and new resolutions - I am sure Yellen and the Fed have their resolutions already in place - we think there resolution is keep economy on track and no need to raise rates - the dollar strength and weakening economies around the world will bolster the demand for US $ and US bonds - we do not see the bond bubble imploding (at keast yet). Seeing the oil collapse and the Russian ruble collapse is making the US dollar gain more strength and we suspect the Chinese RMB will get weaker - with the Chinese economy slowing - the Chinese will have no choice but to allow the RMB to weaken and make their exports competitive and with the Chinese economy driven by exports to EU and other nations with weakening currencies and economies - the RMB has to fall further. That is our prediction for 2015 - what does this do to gold - with energy prices down we expect gold to drop also - but we will have to keep an eye on this - gold may also become the currency of choice - a tricky catch 22 situation. Oil drop is, we believe, a political driven drop and maybe mixed in with a hint of over-supply. This is affecting major economies like Russia, Venezuela and other major oil-producing nations. We expect oil to be range bound between $45-$70. We went long USO and LINE this week.  The economies of US states like Texas, Oklahoma, ND will be affected by this drop in oil price - we will have to see the impact.

Fed action - we do not expect any rate hikes this year as we stated earlier.

Stock bubbles and valuations - There is no doubt we are in a stock bubble - the accounting shenanigans, stock buybacks help moved the stock prices and earnings. Many stocks and sectors are trading at above average PEs - with the Fed holding back on raising rates, we expect stocks to possibly rise this year as there are almost no alternatives to make a decent return. Stocks look extended short-term and we expect a pullback here and will have to keep a close eye on the earnings and forward forecasts for Q1. Semi stocks were downgraded last qtr by BofA Merrill Lynch and this a sign that the semi stocks have had a nice long bull run and we would expect a pullback. Keep an eye on the following stocks SWKS, TXN, ALTR, XLXN, SYNA, MXIM, SIMO etc.

VC funding and company valuations are still outrageous and it smells a lot like 1999.

We also expect major dividend cuts from the energy sector stocks - so please keep a close eye on your small to mid-sized oil and energy stocks with current high payout and high dividend payments - these will definitely impact the stocks prices.

Consumer staple stocks and retail stocks are holding up well and we expect the retail sector to show decent earnings. There have not been any major warnings to date - with the gas prices at the pump dropping, we expect that consumers used this opportunity to spend more on gifts etc during this Christmas season.

Utility stocks had a huge run due to the drop in bond yields and we need to keep an eye on these - there was pullback on Friday - but we expect that this sector will still be strong this year unless there is a bond rout.
We added a new feature to our stock site: Multiple stocks charts on one page - check this link: www.trucharts.com/multiplestocks.aspx.

We additionally added Ichimoku cloud and turtle trading system - these are available on the www.trucharts.com/stockview.aspx.

We will be publishing the definitions and charts for all the indicators on our site soon.

Check out this stock LINE which we went long for a short term trade: www.trucharts.com/stockview.aspx?TICK=LINE.

Gold miner stocks were up on Friday - keep an eye on GDX, GDXJ.

Trucharts positions: Short GM (due to recall), technically stock extended, ALTR, DAL, IBB, AEM. Long USO, CYBR, WSM, K, HMY, LINE.

Best of luck for 2015 and use our site for auto buy/sell signal strategies and as we keep making improvements, we will keep you posted.

Thanks and please help us spread the word - our subscription price is one of the lowest and best in the industry for the type of information we provide to our users and if you have any ideas for improvements or information you would like us to add, please email our CEO and founder directly at bbhatia@trucharts.com - we look forward to your comments and feedback.

Trucharts Team
December 28, 2014

Trucharts.com - Stocks to watch and Marlets blog week ending 12/26/2014

Trucharts.com Markets Update Blog week ending 12/26/2014:

Well now we have the New Year week coming up and markets keep making record new highs. This is the highest number of new record highs hit in one year. DOW and S&P500 are still trending higher. Keep an eye on the 13 and 15 week moving averages for the stock indices and the stocks - these are very critical - you can check these on our site when you click on the week option for period on the stockview.aspx page (www.trucharts.com/stockview.aspx). There was record amount of money put into stock ETFs this past week - check this article - http://finance.yahoo.com/news/u-based-stock-funds-attract-001225961.html; There are technical indicators that look weak - like lower RSI and lower MACD on higher highs - but these are not necessarily pointing to any pullback at the present time. We are still in a seasonally strong period for equities and heading into a New Year - we do not see anything other than some minor pullbacks as we head into the earnings season. Oil seems to be trying to find a bottom here; gold bounced on Friday - we will keep an eye on this - specially due to the turmoil in the currency market in Eastern Europe (including Russia). 

We are long USO, AMKR and short AEM. Our target for gold is still 1000. There are several stocks that look strong - here are th symbols and charts -AAPL and more. We are looking to go long AAPL this week. The rules are very simple - DO NOT FIGHT THE FED and STAY WITH THE TREND. Now the Yellen put is in place and everyone does not epect any major change in the Fed' stance this comng year (till at least middle of 2015) - companies revenues are not growing based on the P/E multiples - yet these stocks keep moving higher - the average PE is being stated as low and this is happening based on significant stock buy backs being used by companies to boost their earnings and EPS. But none of these matter, since the belief is that stocks will just keep moving higher. We will stay with the trend until it breaks - (Ms Yellen (Ms Clause) will come save the day).

Here are some other symbols to watch this coming week:

For full disclosure - we are long AMKR, WSM, BIS, CYBR, K and short ALTR, DAL, YHOO, AEM (will close YHOO this week).

We added a special new feature on our site - check it out at: http://www.trucharts.com/multiplestockcharts.aspx (mulitple charts on one page)

Some good reading material: (ADDED ANOTHER GOOD ARTICLE)

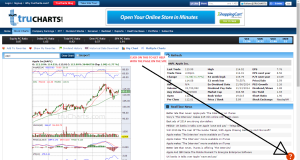
Here is the picture of how to use and access help on our website with any page.
Trucharts help


Check out our special subscription offer - no more monthly recurring fees - just $90 for the full year (50% discount)- here is the link: http://www.trucharts.com/truCharts_Services.aspx

Happy New Year to all - and good luck with trading in the New Year.

Trucharts Team

December 21, 2014

TruCharts.com – Free Stock Charts – Blog week ending 12/19/2014

Trucharts.com Blog week ending 12/19/2014

For SEO: Trucharts.com – Stock Charts Free, Stock Market, Stocks, Charting, Dividend Stocks, World Markets, Technical Analysis, Market Sentiment Charts
Merry Xmas and happy holidays to all. We are in a short week of trading this week and the fireworks were on last week after Fed Speak. We did not expect any surprises from the Fed on the raising of the Fed Funds rate, and the Fed made it a point to tell the markets that it was still ok to take risks and that drove the markets to recover over a 800 points on the DOW and 100 points on the SP500. A lot of this was driven by energy stocks and since some of the stocks had dropped over 50% – there were short covering rallies and bottom fishing and a major short squeeze. BofA Merrill Lynch downgraded several semi stocks but these did not correct as much. The SP500 and DOW look like they are still in an uptrend and our indicators are still showing a trend for the markets to mover higher – after a short consolidation period. The move this past week was massive, but the volumes in some stocks was not high. 
We like XLU (www.trucharts.com/stockview.aspx?TICK=XLU) and the utility stocks as good dividend earners. Check out the charts for SO, ED, PCG and DUK. Even the REIT’s look good and some consumer staple stocks look good. We took a position in K or Kellog (www.trucharts.com/stockview.aspx?TICK=K) and USO – we believe this has finally bottomed for the short term. Keep an eye on CAT (www.trucharts.com/stockview.aspx?TICK=CAT) – we are looking to take a position in CAT. 
We have been hurt by our short position in IBB – but have been writing puts to improve our short price. Our other positions are doing OK – Long WSM, short YHOO (plan to close Monday), DAL, AEM. We are looking to go long CYBR.
There is definitely a XMAS rally going on and we expect this to last into the New Year – until the earnings season starts. AAPL (www.trucharts.com/stockview.aspx?TICK=AAPL) still looks good technically.
We added some new features to our site this week – execiting stuff:
1. MULTIPLE SYMBOL CHARTS on one page – check this feature out at: http://www.trucharts.com/multiplestockcharts.aspx
2. ICHIMOKU cloud indicator on our stockview page and turtle trade indicator
3. Added borders to our charts
Check the features out and also our page: http://truchartscom.blogspot.com/p/why-is-trucharts.html
In addition, we want everyone to take advantage of avoiding monthly recurring fees  and sign up NOW for one very low annual membership for full access for just $90/year – a 50% discount to the annual membership fees and this gives you real time categorized news and complete access to all of the site including dividend stocks etc.
Again – Best wishes for the holidays to all and a Happy New Year and good luck trading.

TruCharts Team

December 15, 2014

Brief Update on Markets 12/15/2014


Free Stock Charts/Scans/Stock Screener at Trucharts.com - 


We talked about gold pulling back and being short IBB - both of these are moving down and the commodity complex breakdown is going to affect gold and gold miners. Russian ruble has completely crashed and is now worse than the Indian Rupee. Amazing what US political power can do. Short AEM, GM and IBB, long BIS and WSM.


Markets were up and everyone was getting excited this morning. Then we had a pullback and we need to wait and see if the markets consolidate here.

Trucharts team

December 14, 2014

Trucharts.com Blog week ending 12/12/2014

Trucharts.com Blog Week ending 12/12/2014


We expected the markets to hit 18000 for the DOW and 2100 for the S&P500. It came close but did not touch these milestones. We stated that the markets were looking extended and that the risk was high - that scenario played itself out this past week. The breakdown in oil and the commodity complex was not surprising. We expect oil to hit between 50 and 55 - that would be more than a 50% correction and we expect some bottoming in that range. The commodity 15 year bull cycle may be coming to an end. Stocks looked extremely extended and one of our sentiment charts was showing that a puulback was imminent. Check out this chart which had predicted prior pullbacks - it is the chart of the stocks below their 50d SMA vs S&P500 - check this chart below:


You can see in the chart above how the trend for the stocks above 50d SMA is trending down even when the market is hitting new highs. This is evident in both the charts for stocks on the NYSE and NASDAQ. It does not appear that this has bottomed. We should keep an eye on this indicator on ur reports page under "Charts" at .

We expect volatility to be up this week and the S&P to touch the 50D SMA at 2000 and we have to see if the buyers jump in. The DIA has it's 50D SMA at 172.4 - we would like to see if this bounces back. The megaphone pattern in the indices is lookign evident - but then we have to wait and watch - if that does play out then the S&P500 has to break below it's previous low on the prior corrction in October. 

Fortunately for our portfolio, we followed our charting buy/sell signal strategies and closed positions in SDRL (down over 50% from our sell price), RIG, USO (all oil related). We stated shorting GM - still looks like a good short - in addition we had shown the chart for FCX as short in our last blog. We are short ALTR, IBB, DAL, YHOO and long BIS, WSM. We have hedged our positions with puts and calls. Although we see opportunity oin shorting AA - we will wait and watch since we are over exposed to shorts currently. 

Good luck trading next week.

Trucharts team 


December 12, 2014

A good stock to short - Check this

Free Stock Charts/Scans/Stock Screener at Trucharts.com:

Check out this chart for SNDK - we made money on this stock last time. Looks like a great short. MACD down, RSI down and stocks breaking down:


Trucharts team

Trucharts.com - Markets Update and stocks to Watch 12/12

Free Stock Charts/Scans/Stock Screener at Trucharts.com:

Markets down today - check out our published chart for SPY - we stated trend was down and we are seeing that manifested in the markets today. Yesterday was a short squeeze and today we are headed to 2000 on the S&P.

Stocks to watch: ADBE, RH - for coming week.  Short DAL, YHOO, AEM and IBB.

This is what our elected officials are doing in the United States of America - watch out for your future and we elected these folks to represent the common man - unbelievable..


December 11, 2014

Trucharts.com Markets update 12/11


Free Stock Charts/Scans/Stock Screener at Trucharts.com: 12/11


Well we had huge ramp this morning - we suspect this was huge short squeeze which led to short covering. The trend is still to the 50d SMA. Oil crashed and gold pulled back. RH stock earnings drove up the retailiers and their forecast was positive. So WSM (we are long) moved up and our shorts are still holding. There was pullback towards the end of the day and the ISEE closed at 54 - one of the lowest readings in the longest time. Watch the 50d SMA for SPY. Markets are trading very technically. Fundamentals are just an excuse now. Bubbles are made of volatility, no fundamentals and lot of big moves in the markets while bears and bulls try to fight it out. We think oil should stabilize in the 55-60 range. Still holding all our positions. We hope there is now a revolt against the airlines for baggage fees - now that oil is down - they should no longer be charging these fees.


Chart for RH at:

www.trucharts.com/stockview.aspx?TICK=RH

Trucharts team

December 10, 2014

Markets Update 12/10/2014

Markets Update 12/10:

Markets down, oil down, gold down and our short positions are right on the money. We have been saying markets look extended here and the commodity crash will impact the markets. We have been short DAL, YHOO, ALTR, AEM and long BIS, WSM, CYBR. We think the markets will test the 50d moving average. GM still looks like a good short.


Watch this closely - HYG - correlates to market performance and trend.

December 7, 2014

Trucharts.com Blog and stocks to watch - Week ending 12/5/2014

Trucharts.com - Blog update and Stocks to watch:

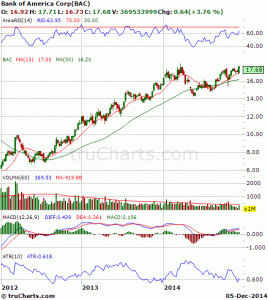
Another week and another set of new records and new highs. There is no stopping this train. Excellent jobs report (321K new jobs created). Oil dropped this week and so did the commodities. Energy stocks are getting slammed and so are commodity stocks. We think there maybe an end coming to the commodity cycle - many have indicated that this is typically a 15 year cycle that started in 2000 and will end by 2015. This will impact commodity stocks - so if you have commodity stocks in your portfolio - like FCX, BHP, RIO - be mindful and this end to the commodity cycle may impact the dividends being paid out by the commodity stocks. Another concern recently has been the drop in the oil sector stocks and their issuance of junk bonds to fund their exploration - the main concern is related to the capability of these companies to pay back this debt due to the drop in oil prices (check JNK). Financial stocks are breaking out. We are watching BAC (Bank of America) - here is the chart (weekly) - looks like it is going to breakout (Other stocks to watch in this sector - financial - JPM, XLF, MS, ETFC, AMTD)
Stock Chart BAC


Gold is still holding between 1100 - 1200 - watching this closely - we still think this is headed to 1000.
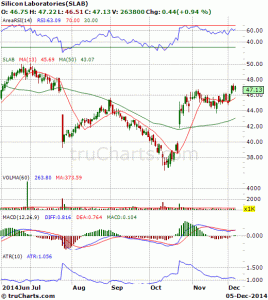
Health stocks and airline stocks were hitting new highs this week along with many tech stocks. AVGOMCHP, SYNA and SLAB announced better outlooks for the coming quarter. We like the chart of SLAB - here is the chart (check the MACD and RSI):
Stock Chart SLAB


Right now the trend is your friend and the don't fight the Fed. We will look to go long the financial stocks this week. Keep and eye on the commodity stocks.
We are still heading into the holidays and a strong period of the year for the markets - we would expect some consolidation - but DOW 18K is imminent and as is SP500 hitting 2100. We are short AEM, IBB (hurting right now), YHOO (will likely close this tomorrow and go long BAC). Watching the stocks above and UTX.
Good luck trading.
Trucharts team

December 5, 2014

Jobs Jobs and more Jobs

Stock Charts - Free and Charting at Trucharts.com: Well what a blowout jobs report - our estimate was 240K and one of the highest estimates and the job reports came in at over 320K. This is good news for the economy but will put pressure on the Fed to raise rates next year. We still do not think this will happen due to the other world economies - but will definitely not spur a QE event. Markets are consolidating here - strong season for markets - we expect new highs. 

Expect stocks to consolidate here.  We will publish a stock to watch list later today.

December 4, 2014

Today's market stats 12/04


Stock Charts Free, Charting / Predefined Stock Scans at TruCharts.com


Today's market stats 12/04 - Markets closed slightly lower from yesterday's close. There was a dip in the morning and then the markets recovered due to some rumor that QE was to be announced by EU zone. The breadth was negative - more than 2:1 on the NYSE and AMEX and 6:4 on Nasdaq (Decliners vs Gainers). ISEE ratio closed at 92 indicating more puts were being traded. Tomorrow is the big jobs number - we expect around 240K+ - due to holiday hiring. We are still holding all our positions - short AEM, YHOO, DAL, IBB and long WSM, BIS, TWTR.  We went long JRJC today for a short term trade.


Good luck trading 

December 3, 2014

Stocks to Watch - 12/4/2014

Stocks to watch tomorrow: SLAB, MCHP, CARB, JCOM.

Here is the slab chart - good for short term trade:


Stock Carbonite takeover - updated

Carbonite stock -

Stock Charts Free, Charting / Predefined Stock Scans at TruCharts.com:

We really missed CARB (Carbonite) - we had an instinct that it would be a takeover candidate and today JCOM announced a takeover of Carbonite.  


Check out the JCOM chart here (amazing):

www.trucharts.com/stockview.aspx?TICK=JCOM

Stock Charts Free, Charting / Predefined Stock Scans at TruCharts.com:

Very good article : Please read 

http://www.marketwatch.com/story/hindenburg-omen-cries-bear-market-again-2014-12-03?siteid=yhoof2

Stock Market Update 12/3/2014 Close

Stock Market Update 12/3/2014 Close Updated with ISEE:

Markets closed strong again today, we still think DOW 18000 is going to happen along with a hit of the 2100 on the S&P. Up Volume on NYSE and NASDAQ was 2:1 which shows there is still strength and trend for a move higher.  Advancing issues was 2:1 (175 new highs and only 74 new lows) on NYSE and 1.6:1 (135 new highs and 86 new lows) on NASDAQ. We have the job reports on Friday and if weak - watch out for bond yields. 


Still long WSM/CYBR/QIHU and YELP.  Short AEM, IBB and DAL.

Stock Charts Free, Charting / Predefined Stock Scans at TruCharts.com:

ISEE closed today at 136 - implying markets are heading higher - this is inline with the internal dynamics of the markets which we have shown above.


Good luck trading.

Trucharts team

November 29, 2014

Trucharts Post thanksgiving blog update - week ending 11/28/2014

Trucharts Blog week ending 11/28/2014

Well what a Thanksgiving week this was. New records were set and the S&P500 had a close over it's 5d SMA for 30 consecutive trading days - a new record. Stocks closed positive for the week and then we had the energy complex stocks getting completely crushed after the OPEC announcement from Saudi Arabia - no production cuts and crude oil suffered one of the biggest drops since 2008. In line with this drop, the other commodities got crushed - gold down, copper down etc., and the big rail stocks also dropped. We indicated that, we think, this was a political move by Saudi Arabia, pressured by US, to put the pressure on Russia and Iran - whose biggest revenue comes from oil exports. Obviously this is bad for all oil producing countries and good for possibly some oil importing countries like India/Japan and others. It will help reduce their account deficits and should be good for the consumer. Tech stocks, biotech and health care stocks did well - but then pulled back at the end of the week. We think the markets are definitely extended here and the move up has been nothing short of being historical. The ISEE P/C ratio closed at 74 on Friday and we expect the markets to pull back this week. We will very likely see a drop in the commodity stocks and the energy stocks. We expect that the drop in energy prices will definitely impact the local economies of Texas, Oklahoma, Louisiana, North Dakota and the shale producers. Expect gold to drop to $1000 and below. We are staying short the gold miners that are still overpriced relative to their peers. Short AEM.

Biotech stocks are definitely in bubble state and it is not clear how long this will last. We are seeing some cracks but not there yet. Market breadth is narrow - meaning that the number of stocks moving up by sector is narrow. Consumer retail stocks should do well with oil prices dropping. GM was up - but we think this will be shortlived - auto subprime loans hit a new historical high and auto inventory for GM dealers is also very high. Along with the issues with the ignition switches, this will impact their bottom line. We are going to watch this one closely and wait for the right moment to short.
We are long QIHU, CYBR, YELP, WSM, BIS, and short AEM, DAL (with tight stops) and IBB.

Below is the link for some good reading this week - a good article on the markets and their direction.

Another very interesting article on the nature of of US consumption and our values:

Here are some charts for your enjoyment (all montly) we would short the XLE based on monthly chart:
cvx_monthlyfcx_monthlyibb_monthlyxle_monthlyxom_monthly

November 28, 2014

Stocks to Watch - Post Thanksgiving Day

Stock Charts Free, Charting / Predefined Stock Scans at TruCharts.com:

Our stocks to watch list for tomorrow (we expect markets to head higher - we are in a bubble and in that environment - it is buy buy and buy) - here is the list:

MXIM, QIHU, TWTR, FB, WUBA, SIMO, AMKR

Have a great post thanksgiving holiday.