Go Daddy Signup

June 14, 2015

Watch these charts closely this week..

Trucharts.com Blog Week ending 6/12/2015:

Watch these things and charts closely this week..

We did not have a chance to write a complete weekly blog last week due to some family emergencies. Finally got over these and now back to writing and watching and trading the markets this week. 

We are sure you must have been noticing the past few weeks how the big market players have been holding the DOW at 18000, SP500 at 2100 and the NASDAQ at 5000 - rigging - you have to wonder. Every week (for the past six weeks), there has been at least one day a week for a positive 3 digit move in the markets and then we have several - what we call - consolidation days - and then we have had news on Greece everyday impacting the moves in the indices. It is becoming like a same story different day.. Still there has been no resolution on the Greece situation, and then we are seeing some news today that the Greeks have not come forth with a solution that pleases the IMF and the Eurozone. Let us see how this unfolds.

Now back to our markets and China - an amazing bubble brewing there in the markets. A billionaire is made everyday and the three drop out due to improper financial conduct by their respective companies - just take a look at Hanergy as an example. 

We think the underlying fundamentals are weak and many stocks are exhibiting weak technicals, and in addition, we think the tech stocks are looking weak. We strongly recommend taking profits in this sector.

Here are some charts from our markets we are watching closely this week. Keep an eye on the 13 week SMA, the 50 week SMA and the 100 week SMA. Amazing support levels for all the ETFs below.

Charts Weekly: 

Check the chart for:

CVX at critical support - we think this could go to 90.
DIA going to 50 week SMA?
IBB at 13 week SMA - still looking good - still not closing below 13 week SMA.
IWM - Russell 2000 ETF - still strong
MMM - heading to 50 week SMA - should be a good buy point for a bounce
SPY- at week SMA - great support here.
TXN - at 50 week SMA - looking weak - may bounce here
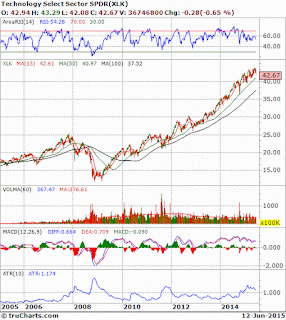
XLK ETF - technology starting to show weakness. (See INTC chart below)


We are long BIDU,CYBR,TWTR,Z, and short AEM,AMBA. Closed DTEA, LLY and UA this week for a good profit.  

IPOs to watch this week: Fitbit - Wednesday - FIT.

Critical earnings this week:

Adobe Systems (ADBE), FedEx FDX, Oracle (ORCL), Darden Restaurants (DRI), Kroger (KR), CarMax (KMX), and KB Home (KBH), DTEA on Tuesday.

Check out our special subscription offer - just $90 for the whole year. The best deal of any technical and stock charting website on the web. Here is the link: 
http://www.trucharts.com/truCharts_Services.aspx

Check out the results of our backtest feature - the fastest on the web: This is for IBB ETF with a 8 SMA crosses 12 SMA and exit is 11 days after crossover - the short needs to be optimized - but the long strategy shows a 174% return.


June 5, 2015

Keep an eye on these stocks and charts!!

Trucharts.com Blog Brief Update:

For SEO:  

Stock Chart(s) Free - Trucharts.com - MACD Chart - Charting, Technical Analysis, Hot Stocks, Real time Stock news:

Here are some stocks we like and are long and also keeping a close eye on:

Jobs reports was strong and USD is moving up and treasuries are dropping and yields are moving higher. Gold down - we are short AEM.

1. DTEA - went IPO today - we are long
2. UA - breaking out of a base - challenging NIKE
3. CYBR - we went long today
4. TIF - like it  - but closed this position
5. BIDU - love this stock 
6. QIHU - looking good for short term trade and China momentum

Charts to watch for SPY and IBB - check the 13 week SMA and 50 week SMA:


May 31, 2015

Markets Direction - Up or Down? Where are we headed? Trucharts.com Blog Update

Markets Direction - Up or Down? Where are we headed? Weekend Blog Update week ending 5/29/15

We have not had a chance to do a weekend update due to the jet lag from travel and other pressing matters. Finally getting some time to put my thoughts down related to the markets from the past 3 weeks and heading into the summer session.

Well NASDAQ hit a new high, markets moved higher and many earnings were reported. Avago bought Broadcom - a $37B acquisition (we think they paid too much - almost 5.5x sales) and then we have Intel buying ALTR this week - from an earnings we had HD, LOW and many other companies that reported earnings in the past couple of weeks. ULTA also reported but the stock reversed after reporting its earnings as did HD. There is talk of additional mergers in the semi company space - here are the companies that we think are ripe for consolidation - MXIM, IDTI, TXN, SLAB, MCHP, ADI, NVDA, AMD, SWKS, MRVL, XLNX, AMBA and probably many others we are missing.  Keep an eye on these stocks. NXPI, AVGO, INTC and other big semi companies would be possible acquirers. With the AVGO and BRCM merger - the merged company will be the 3rd largest semiconductor company after INTC (1) and QCOM (2).

Our drug stock picks LLY, MYL and TEVA still holding strong. The biotech sector has been holding the NASDAQ up and we expect that this sector will eventually fall - we just cannot predict when - there is technical weakness in the ETFs in the biotech sector.

We are very concerned about the underlying weakness in the markets - structurally. We are seeing many stocks breaking down in the DOW and S&P500. In addition, stocks are reversing after reporting earnings - check HD, ULTA. Housing stocks are dropping - indicating that the markets are anticipating rate hikes from the Fed. We think the Fed sees an asset bubble and are being left with no choice but to start raising the Fed funds rate. Housing prices are moving up. unemployment is down to 5.3%, homes on the west coast are selling at prices higher than asking - and this has been the longest period for the rates being at near zero - now close to 6+ years and over the past week we posted an article on FB and G+ where Byron Wein discusses how the Fed has pumped over $3T into the markets - we concur. And then we see this article over the weekend:

All these are pointing to over valuation in the markets and the complacency is remarkable. The VIX was down last week and we expect this to spike higher in the coming weeks. We stated that we would take profits here and hedge positions with calls and puts. Adding some shorts is in our plan for the coming week.  We are long BIDU, TWTR, Z (all hedged with covered calls) and are looking to short MSFT, and possibly IBM. 

Just take a look at the stocks that popped on our sell signal strategy here:Just sort the page by volume from highest to lowest by clicking on the volume column twice: 

Watch for our regular daily posts and positions updates on Twitter and FB.

Again - watch the Greek situation, China stock bubble, and sell here to take some profits and wait for a better opportunity.

Good luck trading. Check out our special subscription rates and we offer the best feature set on the web for our lowest subscription rates - here is the link: 

Do checkout our backtest feature - it is the fastest on the web and ummatched by any site.
Link is: Backtest feature - play with it and you can use it to try some paper trades.

Please help by spreading the word of our site.

Trucharts founder and team

May 27, 2015

Stock Market 5/28 - Midday Update Tuesday - Trucharts.com -

Midday Market update: 5/27


Stocks are bouncing back from the drop yesterday post Memorial day holiday from a possible buy the dip philosophy and possible Greece solution. 

We doubt this move/rally and would look to sell into rallies and take profits - NASDAQ is up from the biotech stock moves and some tech stocks. We like $DE, $BIDU and went long $TIF today. Stocks getting hammered are $WDAY, $KORS and $SHAK.  We like $MO and the tobacco stocks for their dividends and would look to go long. Short gold for now.

Markets look extended still and volatility is still low. Oil is dropping. Watch SVXY and VXX.

May 21, 2015

BIDU and TEVA update

Updates on our picks - Trucharts.com - 


Stock Chart(s) Free - Trucharts.com - MACD Chart - Charting, Technical Analysis, Hot Stocks, Real time Stock news:


We had picked BIDU and TEVA yesterday - both of these are up today - BIDU is up over $3 and TEVA is up over $1.25. We expect markets to be volatile next week post Memorial day weekend. We would sell into rallies - take some profits here.

Trucharts Team

May 17, 2015

Where are the markets headed - UP or DOWN?

Trucharts.com - Blog Update - Week ending 5/15/2015

Where are the markets headed - up or down??

We were unable to publish our blog for week ending 5/8 as we were in China due to blogging restrictions. We are going to summarize the market events for the last two weeks and provide our outlook for the coming weeks and thoughts on some trading.

Well we noticed a pattern during the past two weeks - markets would be sluggish during the early part of the week and then ramp into the end of week trading - week of 5/8 we had a huge move on Friday and last week the big move occured on Thursday. Bonds which have been crushed for the past few months (see TBT chart below) bounced back and it is currently oversold and we expect TBT to move up to its 50d SMA. This will lead to a drop in yields in the coming weeks and interest sensitive stocks should move higher - housing stocks like DHI and LEN to move higher. Markets moved higher on Thursday due to the lower retail number print and the jobless claims number. The markets are totally schizoprehnic - every data point is like a tug of war between the bulls and the bears - but we think the bulls are winning.

The indices like S&P500 brokeout to a new high last week and we expect the move higher. Check the charts below for DIA, SPY, SVXY and TNA. With the Fed pumping money into the economy and staying on the sidelines with the low or ZIRP will drive stocks higher. The Fed is stuck in a corner and we have been saying this for weeks. There is internal strife within the Fed governors and there is lot of jawboning going on the interest rate hike front. This is creating a stable trading environment in stocks - we especially like the drug stocks and stocks with weekly option expirations. The NASDAQ moves are being dictated by the biotech stocks. We expect the biotech ETFs to move higher here - these have still not closed below the 13 week SMA.

Our USO position closed on Friday, we are looking to go long BIDU,TWTR. Oil did bounce back and is back at being above $60. Gold rallied and we expect a pullback. The Greece situation has been nothing but noise. Eurozone economies did well due to the pullback in the Euro, but the markets saw a pullback last week. China is in a bubble and will not end until everyone is loaded up - there is a billionaire being made every week - reminds us of the 2000 Nasdaq tech bubble. 

We are still long MO,DNKN,BIDU and we will close our BOX position this week.

ISEE C/P ratio hit a new 52 week high on Thursday - it recorded a reading of 228 and that means over 2.2 calls were being bought for every put. This typically points to a higher market. Hedges are cheap now as volatility is low and we recommend buying some SPY puts and or puts for your positions at 10% below for 30d out timeframe.

Checkout our backtest article we posted last week for our site and also check out excellent subscription rates for full access and it is currently discounted at 50% for one year access - here is the link - http://www.trucharts.com/truCharts_Services.aspx and we would really appreciate if you can spread the word for our site - and create a buzz - we know we have one of the best stock charting sites on the web. We have updated our home page and are still adding features daily. Check these out and send us your feedback - support@trucharts.com - your feedback is so critical to help us improve our user experience. 

Closed EEM short.

Here are some articles for some good reading this week. 

http://www.zerohedge.com/news/2015-05-16/what-goldman-telling-its-clients-sell-may-and-dont-come-back-one-year

http://www.zerohedge.com/news/2015-05-16/one-gauge-investor-sentiment-just-hit-6-year-high

http://www.zerohedge.com/news/2015-05-17/presenting-77-billion-p2p-bubble

Here are the charts we are watching this week:


Good luck trading. 

Trucharts Team


May 13, 2015

Backtest feature at Trucharts.com

Backtest feature at Trucharts.com:

Stock Chart(s) Free - Trucharts.com - MACD Chart - Charting, Technical Analysis, Hot Stocks, Real time Stock news:

Check this customizable backtest feature on our site - we show here an example run for SMA cross with a 10day exit after the event occurs and you can see over 1000 bars the profit was 165%. SMA crossover is 5d crosses above 9d SMA. You can customize these for long or short events for any stock. Green color transactions point to profitable trades.


May 9, 2015

Blogging restricted

To all our readers - Sorry we have not been able to update any of our blogs and other social feeds due to restrictions in China (due to our travel here). We will provide an update on the markets for the past week and stocks to watch for the coming week. Thank God Hong Kong is still freer than China - we will see how long that lasts.

Trucharts Founder/CEO

April 26, 2015

We made over 18% in three weeks? What did you trade?

Trucharts.com Blog week ending 4/24/2015

Free Stock Chart(s), Technical Screener, MACD Charts, Scanner, Real Time Stock News, Stock Patterns, Stock Quotes, Portfolio Management, Earnings Calendar and more:

Well the stock markets have been going through a nice up trend with this earnings season in full force. Stocks in many sectors were rocking and not so in some sectors. The technology semiconductor sector looks like it has topped out in earnings - check how AVGO, NXPI, TXN (reported earnings and tanked) and many others are pointing to a slowdown in this sector. We were short SMH and recommending shorting NXPI and AVGO in our last blog. We would stay short SMH.

In addition, next week we have the moment of the quarter earnings from AAPL on Monday and then TWTR on the 29th (and BIDU also). FB (Facebook) earnings did not look strong and we still do not like FB due to its valuation. Google stock moved, primarily due to short covering. AMZN was a blowout - unfortunately we think here it is expensive here - even though it may move higher. The earnings will keep going this week and you can check the earnings calendar for your stock on our stockview page in the data box and on our earnings calendar page at: Earnings Calendar.

Here is a stock we talked about shorting and looks like a great candidate for short - please always hedge your position by buying an out of the money call. We always hedge our positions. Stock is IPGP and here is the chart:


Stock is closed below 13d and 50d SMA - target would be 85 and below.


Gold got killed last week but we think this is going to be range bound from $1100 to $1200 and we will keep a close eye on this. Some commodity stocks did well this past week - check out RS, VALE.

Markets are still trending higher - we think there is a chance for a breakout here and we have to see if there is follow through. Chinese markets are on a roll - bubble brewing but not over yet.

Now how did we make 18% - we traded TWTR stock - TWTR has been range bound between 49 and 53 and we bought the stock for 3 weeks in a row and wrote the covered calls for each of those weeks, since TWTR has weekly options. We traded 400 share blocks and our investment was $10000 and our net profit was $1800. Total return - 18%. We are still long TWTR and plan to stay long into earnings - we think TWTR is beating FB (facebook) and is growing now. We will write covered calls for next week May 1st - Friday for part of our position.  Anyway - I wil be traveling this week and will still try to publish and update the blog next weekend. Check out our site for excellent real time stock news and excellent features like mouseover charts/automated buy and sell signals for any stock which you will find on no other sites. We charge the lowest subscription fee for full access to our site. We need your support and we have been providing actual trades and the best picks for the last 6 months - all for free.

April 19, 2015

Was it a market Correction? Or the start of something bigger?

Market Correction or is the market going to crack here?

Markets on Friday pulled back and broke the 50d and 13d SMA from the wedge pattern we discussed in our last blog. The NASDAQ closed above its 50d SMA. Here are the charts with critical short term trendlines. We expect support for SP500 around 2048 area and for the DOW around 17450. For NASDAQ, around 4850. These will be short term critical support areas. 

There was news on new housing starts which was not good heading into the peak home buying spring season and the housing stocks - check (www.trucharts.com/stockview.aspx?TICK=LEN as an example). Then we had news from Greece and possible default, then the news of the slowdown in China growth and the stock market bubble - investors opened over 4.8M accounts in one week - think about that number 4.8M in one week - Wow!! China is experiencing the same bubbles we had in the US - stocks bubble, housing bubble and then now again stock bubble. There are bubbles brewing everywhere and now for the first time San Francisco median price crossed $1M - this is what happens when money printing machine is running non-stop.


Check the trendlines for the DOW, SP500 and NASDAQ. Watch the levels closely. We have been in a sideways consolidation pattern after the breakout in Oct of 2014. There have been breakouts, but the markets have still been in a sideways pattern. Support for DOW is around 17000, SP500 support is at 1980 area.


With the earnings season in full force there have not been too many surprises - PM raised forecasts and the tech companies have had lackluster earnings - even the forecasts have been muted. We think this is the peak of the tech cycle. 
We are looking to short XLK (www.trucharts.com/stockview.aspx?TICK=XLK
and/or SMH/IPGP (www.trucharts.com/stockview.aspx?TICK=IPGP) for the short term. 

There is a another set of earnings barrage coming next week and the week after - IBM, AAPl, TWTR, YHOO and many more - check this link on our site for the earnings calendar: http://www.trucharts.com/EarningsView.aspx?qst3=qstthisweek.

Our all long portfolio was down only 0.1% on Friday even though the markets were down over 1% each and our long/short portfolio was up 0.5% on Friday. We hedge all our positions and our TWTR position was called away on Saturday. We are long MO, USO, BIDU, TWTR. Short positions are AEM, IBB and SNDK position closed on Saturday.

Check out our special susbscription rates for full access - our features are bar none the best of the web - we are aware of other sites that charge just $35 per month for the real time news feature. Here is the link to our subscription page and our site features:

http://www.trucharts.com/truCharts_Services.aspx

http://truchartscom.blogspot.com/p/why-is-trucharts.html

Good luck trading.

Trucharts Team