Go Daddy Signup

Showing posts with label Technical Analysis. Show all posts

January 19, 2015

Trucharts Blog Stock Charts Free - Week ending - 1/16/2015

Trucharts.com Blog week ending 1/16/2015. 


Happy MLK day - markets were closed today - but what a closing on Friday almost 8:2 advancers vs decliners on NYSE and NASDAQ - we suspect short covering rally and short term oversold conditions - but technically the markets look weak and we had a 13d SMA crossing the 50dSMA for the indices - we expect a bounce to the 50d SMA - we had a strong close and gold moving higher, along with oil. And then we had the Dutch cut their interest rates to -ve. SO we pay the banks money to hold cash - think about that for a second - you pay the bank to hold your money - wow!! Then there is the expectation that the ECB will unleash another round of QE - when are the idiots in the Eurozone get it through their thick skulls - QE does nothing in a heavily taxed and socialistic government structure - reduce taxes and act like Ronald Reagan and let's see what happens - really dumb people lining their pockets. So stupid.

Today China reported the GDP number - 7.4% and then yesterday the markets in China got crushed as China pricked the stock bubble by regulating margin accounts which were non-compliant to the capital requirements. Now everyone expects China to unleash another round of stimulus. The whole world and asset prices are now running on steroids - that is what I call QE and all these stimulus injections into the economy - eventually these will hurt and the central banks are scared shit. Gold is the real currency and there is now a currency war in play an oil glut and stocks/real estate in bubbles everywhere. We never seem to learn from our mistakes.

This will be the start of the earnings barrage week - check the earnings calendar on our site at: http://www.trucharts.com/EarningsView.aspx

We closed our ALTR calls last week - our call on ALTR short was correct.
DAL - we sold puts for Jan 30 for 44 strike - we are still short DA and the 44 puts, GM and F.
Our GM call spread for 34.5 and 36.5 expired worthless. Our stock K is doing well and we are long WSM, TWTR, CYBR, USO and ANV. We still like gold here because it broke through resistance and the Chinese New Year is in February.

Here are some good picks for the coming week -
XLU (www.trucharts.com/stockview.aspx?TICK=XLU); Other stocks (www.trucharts.com/stockview.aspx?TICK=SO) - the utility stocks look good in this falling interest rate environment. Our call on HELE was good - still looks strong.

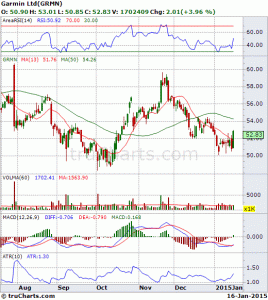
Chart of GRMN here below - looks good technically for a short term trade:


GRMN stock chart

January 4, 2015

Trucharts.com Weekly blog - stocks to watch week ending 01/02/2015

Trucharts.com Weekly blog week ending 01/02/2015


For SEO: Stock Charts Free, Charting, Stock Market, Technical Analysis, Stock Blog, Stock Buy and Sell Signals.

Happy New Year 2015 to all:

Market Stats:                     DOW 17832.99; S&P500: 2058.20; NASDAQ: 4726.81

NYSEAmexNASDAQ
New Highs55564
New Lows23531
Up Volume1,317,747,081 (49%)54,149,125 (72%)640,070,736 (47%)
Down Volume1,361,184,794 (50%)18,108,068 (24%)714,790,713 (52%)
Unchanged Volume31,963,947 (1%)2,449,256 (3%)11,961,935 (1%)
Total Volume2,710,895,82274,706,4491,366,823,384

New Year and new resolutions - I am sure Yellen and the Fed have their resolutions already in place - we think there resolution is keep economy on track and no need to raise rates - the dollar strength and weakening economies around the world will bolster the demand for US $ and US bonds - we do not see the bond bubble imploding (at keast yet). Seeing the oil collapse and the Russian ruble collapse is making the US dollar gain more strength and we suspect the Chinese RMB will get weaker - with the Chinese economy slowing - the Chinese will have no choice but to allow the RMB to weaken and make their exports competitive and with the Chinese economy driven by exports to EU and other nations with weakening currencies and economies - the RMB has to fall further. That is our prediction for 2015 - what does this do to gold - with energy prices down we expect gold to drop also - but we will have to keep an eye on this - gold may also become the currency of choice - a tricky catch 22 situation. Oil drop is, we believe, a political driven drop and maybe mixed in with a hint of over-supply. This is affecting major economies like Russia, Venezuela and other major oil-producing nations. We expect oil to be range bound between $45-$70. We went long USO and LINE this week.  The economies of US states like Texas, Oklahoma, ND will be affected by this drop in oil price - we will have to see the impact.

Fed action - we do not expect any rate hikes this year as we stated earlier.

Stock bubbles and valuations - There is no doubt we are in a stock bubble - the accounting shenanigans, stock buybacks help moved the stock prices and earnings. Many stocks and sectors are trading at above average PEs - with the Fed holding back on raising rates, we expect stocks to possibly rise this year as there are almost no alternatives to make a decent return. Stocks look extended short-term and we expect a pullback here and will have to keep a close eye on the earnings and forward forecasts for Q1. Semi stocks were downgraded last qtr by BofA Merrill Lynch and this a sign that the semi stocks have had a nice long bull run and we would expect a pullback. Keep an eye on the following stocks SWKS, TXN, ALTR, XLXN, SYNA, MXIM, SIMO etc.

VC funding and company valuations are still outrageous and it smells a lot like 1999.

We also expect major dividend cuts from the energy sector stocks - so please keep a close eye on your small to mid-sized oil and energy stocks with current high payout and high dividend payments - these will definitely impact the stocks prices.

Consumer staple stocks and retail stocks are holding up well and we expect the retail sector to show decent earnings. There have not been any major warnings to date - with the gas prices at the pump dropping, we expect that consumers used this opportunity to spend more on gifts etc during this Christmas season.

Utility stocks had a huge run due to the drop in bond yields and we need to keep an eye on these - there was pullback on Friday - but we expect that this sector will still be strong this year unless there is a bond rout.
We added a new feature to our stock site: Multiple stocks charts on one page - check this link: www.trucharts.com/multiplestocks.aspx.

We additionally added Ichimoku cloud and turtle trading system - these are available on the www.trucharts.com/stockview.aspx.

We will be publishing the definitions and charts for all the indicators on our site soon.

Check out this stock LINE which we went long for a short term trade: www.trucharts.com/stockview.aspx?TICK=LINE.

Gold miner stocks were up on Friday - keep an eye on GDX, GDXJ.

Trucharts positions: Short GM (due to recall), technically stock extended, ALTR, DAL, IBB, AEM. Long USO, CYBR, WSM, K, HMY, LINE.

Best of luck for 2015 and use our site for auto buy/sell signal strategies and as we keep making improvements, we will keep you posted.

Thanks and please help us spread the word - our subscription price is one of the lowest and best in the industry for the type of information we provide to our users and if you have any ideas for improvements or information you would like us to add, please email our CEO and founder directly at bbhatia@trucharts.com - we look forward to your comments and feedback.

Trucharts Team

January 2, 2015

Trucharts.com Blog Update for Markets Jan 2, 2015


Stock Charts Free, Charting and Scans - Trucharts.com


Markets Update Jan 2, 2105

Happy New Year to all.

Well the market makers did what they had to do today to make the DOW positive. Even with negative economic news this morning and the apparent disaster looming in the EU - DOW ended positive for the day. OIL still heading down - we went long LINE for a short term trade - volume was almost 3.5x avg volume (they reduced dividend from 2.90 to 1.25 still a decent yield). Gold was flat and we closed out YHOO position today and went short GM after the recall news. 


Low volume day - now all eyes are on next week and then the earnings barrage. We are still short DAL, AEM (up today) with covered puts and long BIS, WSM, K, CYBR, USO.

Check out our new feature for mulitple stock charts on a single page at: http://www.trucharts.com/multiplestockcharts.aspx


Trucharts team

December 28, 2014

Trucharts.com - Stocks to watch and Marlets blog week ending 12/26/2014

Trucharts.com Markets Update Blog week ending 12/26/2014:

Well now we have the New Year week coming up and markets keep making record new highs. This is the highest number of new record highs hit in one year. DOW and S&P500 are still trending higher. Keep an eye on the 13 and 15 week moving averages for the stock indices and the stocks - these are very critical - you can check these on our site when you click on the week option for period on the stockview.aspx page (www.trucharts.com/stockview.aspx). There was record amount of money put into stock ETFs this past week - check this article - http://finance.yahoo.com/news/u-based-stock-funds-attract-001225961.html; There are technical indicators that look weak - like lower RSI and lower MACD on higher highs - but these are not necessarily pointing to any pullback at the present time. We are still in a seasonally strong period for equities and heading into a New Year - we do not see anything other than some minor pullbacks as we head into the earnings season. Oil seems to be trying to find a bottom here; gold bounced on Friday - we will keep an eye on this - specially due to the turmoil in the currency market in Eastern Europe (including Russia). 

We are long USO, AMKR and short AEM. Our target for gold is still 1000. There are several stocks that look strong - here are th symbols and charts -AAPL and more. We are looking to go long AAPL this week. The rules are very simple - DO NOT FIGHT THE FED and STAY WITH THE TREND. Now the Yellen put is in place and everyone does not epect any major change in the Fed' stance this comng year (till at least middle of 2015) - companies revenues are not growing based on the P/E multiples - yet these stocks keep moving higher - the average PE is being stated as low and this is happening based on significant stock buy backs being used by companies to boost their earnings and EPS. But none of these matter, since the belief is that stocks will just keep moving higher. We will stay with the trend until it breaks - (Ms Yellen (Ms Clause) will come save the day).

Here are some other symbols to watch this coming week:

For full disclosure - we are long AMKR, WSM, BIS, CYBR, K and short ALTR, DAL, YHOO, AEM (will close YHOO this week).

We added a special new feature on our site - check it out at: http://www.trucharts.com/multiplestockcharts.aspx (mulitple charts on one page)

Some good reading material: (ADDED ANOTHER GOOD ARTICLE)

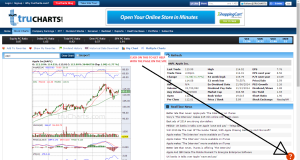
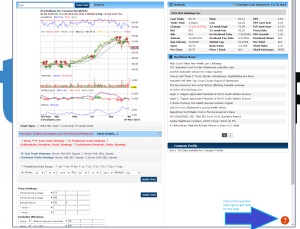
Here is the picture of how to use and access help on our website with any page.
Trucharts help


Check out our special subscription offer - no more monthly recurring fees - just $90 for the full year (50% discount)- here is the link: http://www.trucharts.com/truCharts_Services.aspx

Happy New Year to all - and good luck with trading in the New Year.

Trucharts Team

December 21, 2014

TruCharts.com – Free Stock Charts – Blog week ending 12/19/2014

Trucharts.com Blog week ending 12/19/2014

For SEO: Trucharts.com – Stock Charts Free, Stock Market, Stocks, Charting, Dividend Stocks, World Markets, Technical Analysis, Market Sentiment Charts
Merry Xmas and happy holidays to all. We are in a short week of trading this week and the fireworks were on last week after Fed Speak. We did not expect any surprises from the Fed on the raising of the Fed Funds rate, and the Fed made it a point to tell the markets that it was still ok to take risks and that drove the markets to recover over a 800 points on the DOW and 100 points on the SP500. A lot of this was driven by energy stocks and since some of the stocks had dropped over 50% – there were short covering rallies and bottom fishing and a major short squeeze. BofA Merrill Lynch downgraded several semi stocks but these did not correct as much. The SP500 and DOW look like they are still in an uptrend and our indicators are still showing a trend for the markets to mover higher – after a short consolidation period. The move this past week was massive, but the volumes in some stocks was not high. 
We like XLU (www.trucharts.com/stockview.aspx?TICK=XLU) and the utility stocks as good dividend earners. Check out the charts for SO, ED, PCG and DUK. Even the REIT’s look good and some consumer staple stocks look good. We took a position in K or Kellog (www.trucharts.com/stockview.aspx?TICK=K) and USO – we believe this has finally bottomed for the short term. Keep an eye on CAT (www.trucharts.com/stockview.aspx?TICK=CAT) – we are looking to take a position in CAT. 
We have been hurt by our short position in IBB – but have been writing puts to improve our short price. Our other positions are doing OK – Long WSM, short YHOO (plan to close Monday), DAL, AEM. We are looking to go long CYBR.
There is definitely a XMAS rally going on and we expect this to last into the New Year – until the earnings season starts. AAPL (www.trucharts.com/stockview.aspx?TICK=AAPL) still looks good technically.
We added some new features to our site this week – execiting stuff:
1. MULTIPLE SYMBOL CHARTS on one page – check this feature out at: http://www.trucharts.com/multiplestockcharts.aspx
2. ICHIMOKU cloud indicator on our stockview page and turtle trade indicator
3. Added borders to our charts
Check the features out and also our page: http://truchartscom.blogspot.com/p/why-is-trucharts.html
In addition, we want everyone to take advantage of avoiding monthly recurring fees  and sign up NOW for one very low annual membership for full access for just $90/year – a 50% discount to the annual membership fees and this gives you real time categorized news and complete access to all of the site including dividend stocks etc.
Again – Best wishes for the holidays to all and a Happy New Year and good luck trading.

TruCharts Team

December 15, 2014

Brief Update on Markets 12/15/2014


Free Stock Charts/Scans/Stock Screener at Trucharts.com - 


We talked about gold pulling back and being short IBB - both of these are moving down and the commodity complex breakdown is going to affect gold and gold miners. Russian ruble has completely crashed and is now worse than the Indian Rupee. Amazing what US political power can do. Short AEM, GM and IBB, long BIS and WSM.


Markets were up and everyone was getting excited this morning. Then we had a pullback and we need to wait and see if the markets consolidate here.

Trucharts team

December 11, 2014

Trucharts.com Markets update 12/11


Free Stock Charts/Scans/Stock Screener at Trucharts.com: 12/11


Well we had huge ramp this morning - we suspect this was huge short squeeze which led to short covering. The trend is still to the 50d SMA. Oil crashed and gold pulled back. RH stock earnings drove up the retailiers and their forecast was positive. So WSM (we are long) moved up and our shorts are still holding. There was pullback towards the end of the day and the ISEE closed at 54 - one of the lowest readings in the longest time. Watch the 50d SMA for SPY. Markets are trading very technically. Fundamentals are just an excuse now. Bubbles are made of volatility, no fundamentals and lot of big moves in the markets while bears and bulls try to fight it out. We think oil should stabilize in the 55-60 range. Still holding all our positions. We hope there is now a revolt against the airlines for baggage fees - now that oil is down - they should no longer be charging these fees.


Chart for RH at:

www.trucharts.com/stockview.aspx?TICK=RH

Trucharts team

November 11, 2014

Trucharts.com Stocks to watch list 11/11/2014

Trucharts.com Markets and Stocks to Watch List


Markets appear extended here - we expect consolidation and small moves to new highs. With the upcoming holiday season, we expect markets to stay within a range of new highs and consolidate into the New Year.

Watch these stocks today:

DHI - reported earnings miss today
ZNGA
BABA
VIPS - earnings this week
BITA - earnings this week
TWC
AMZN - moving higher - chart at:AMZN Chart

Check our earnings calendar at:

http://www.trucharts.com/EarningsView.aspx

Trucharts team


November 10, 2014

Trucharts.com - Stockwatch List

Turcharts.com - Stocks to Watch List


Here is our list of stocks to watch for this week:

NSC    - Up today $3 - our buy signal triggered on Friday and shown in our blog
ABBV  - Up today $2
XOP    - down - but we think consolidating
T        - moving higher
MO     - hitting new highs
JRJC   - China allowing foreign investors access to China markets
USO    - Consolidating - watching closely to see breakdown or move up
WSM   - Watch closely - earnings expected 11/19

Trucharts Team

November 9, 2014

Trucharts.com - Stocks to watch week of 11/10 and Blog Update week ending 11/7/2014

Trucharts.com - Blog and markets Update for week ending 11/7/2014

Mid-term elections done - well the GOP won and now we have to see their agenda. Employment news - which was so-so and with that we had, oil rallying after being trounced, gold rallying on Friday after hitting new lows and the gold miners rising.  Markets hitting new highs and VIX dropping (as we had been indicating for quite some time) - we still expect the VIX to drop and markets to consolidate their gains here and breadth is narrow. Markets are heading into a strong cycle - end of the year when holiday season starts and into the new year.  We do expect to see some pullback from this big move, but move to new highs is still in the cards. With the Fed staying put on interest rates, we do not expect any type of major pullback in the markets. The Fed will not raise rates till next year - and that will drive the markets' direction. With no other avenues to make good returns, investors have no choice but to put the money into markets and now the BOJ announced a round of stimulus to put money into stocks - that just gives the markets more impetus to move higher.  Pockets of strength still exits and we need to take advantage of these.
We are looking to the following sectors and stocks next week. Oil and energy stocks/ETFs, gold miners for short term trades.
We have added a very helpful feature on our site to help and assist our users on how to use each page and a description of each field on the page. Please check this image below for this feature - it is on each page of our site now (except home page which is under re-design).
help_photo
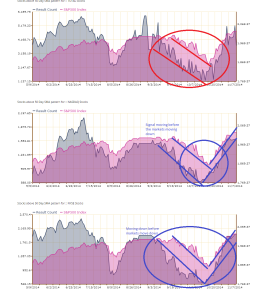
Here we wanted to show below how the sentiment charts from our site predicted this massive move up and the correction we experienced 3-4 weeks ago in the markets - note the drop in the stocks above 50d SMA before the markets actually went down and then the rise in stocks above 50d SMA before the move up in the markets. The signals are very clear prior to the market moves - we have highlighted these with the trend lines. You can see clearly that we are at a top and a sideways market for the next few weeks and possible pullback prior to thanksgiving.  As you can see the stocks above 50d SMA is moving down and we are in a topping mode for the markets. We have several such indicators for all the reports we generate on our reports page:
Sentiment Signal prior to market moves
Here is our list of stocks to watch for the coming week:
Buy SIgnal: www.trucharts.com/stockview.aspx?TICK=XOP
www.trucharts.com/stockview.aspx?TICK=NSC
www.trucharts.com/stockview.aspx?TICK=TGT 
www.trucharts.com/stockview.aspx?TICK=DO (watch)
www.trucharts.com/stockview.aspx?TICK=ETP
www.trucharts.com/stockview.aspx?TICK=CNQ (short term trade)
Good luck trading.
Here is the udpate from our hedge fund manager for his performance from last week (cumulative return for a $50000 account):


November 4, 2014

Trucharts.com - Help file for REPORTS page - Check this out

TRUCHARTS.com - REPORTS page Help files


Stock Charts - Trucharts.com - Help file for REPORTS page - Here below today we have attached two pcitures showing the details for our reports page and the explanation of the fields - you can also see our mouseover feature  - you can access the page at: www.trucharts.com/marketreports.aspx.


October 30, 2014

Trucharts.com Market Update 10/30/2014

Trucharts.com Market Update 10/30/2014


Well we are definitely getting a wild roller coaster ride today.  Stocks we picked yesterday are booming today from our watch list - stocks like V, MA, BIDU.  BIDU is a breakout and relative to Google valuation - it is still cheap.  V and MA look very tradeable here.  We shorted AEM - gold is definitely heading lower and the gold miners will get crushed even more.  We had covered our short on AU too early.  

Also check out this news article on China bad loan problem:


Long V, MA, BIDU - short gold and gold miners.

Trucharts Team

October 27, 2014

Trucharts.com - Markets Update - 10/27


We had indicated that markets will move higher this week and the markets were flat today.  Oil is still heading down - and the energy stocks are getting crushed - just look at some of the offshore drillers and equipment suppliers - HAL. NOV, DO, SDRL, RIG (www.trucharts.com/stockview.aspx?TICK=RIG) - just getting totally hammered.  This does not bode well - even though we think oil complex is getting extremely oversold - we wrote covered call on our USO position today.  Gold was down today - that is not a good sign for the commodity complex and the miners which have been hammered to almost ridiculous valuations.

TWTR, BWLD and AMGN reported earnings after hours.  TWTR was down almost 10% in after hours trading.  Cannot generate enough users and offered in line estimates.  BWLD and AMGN reported positive earnings - we will see how these will react tomorrow.  We had picked BWLD in our weekend blog.

Additionally we had indicated to keep on stock Alibaba - symbol BABA (www.trucharts.com/stockview.aspx?TICK=BABA) - that was up today.

We like CYBR - closed strong today - we expect that to go higher tomorrow.

We will keep an eye on VIX and the Biotech sector - a very crowded trade and now everyone is jumping on the bandwagon of the biotech sector.  


Our positions are still holding long AAPL, T and watching BABA. Expect some consolidation next week - due to heavy earnings calendar next week. Our short on GM is still looking good. 

Many biotech earnings are coming out this week.  We will have to watch these closely - the biotech stocks are very extended technically.  

Good luck trading..

trucharts team

October 23, 2014

TruCharts.com Update on stock TUBE


Go check our blogs and picks and the stock TUBE has been on our list for the past 3 weeks and today it broke out - here is the latest close as of today 16.73 Up 2.94(21.32%) 4:00PM EDT up 21%.  There you go technical analysis works - use it and stop all this other fundamental nonsense. 

Here is the chart - major breakout - today:

October 22, 2014

Stock Charts - Trucharts.com 


Based on the charts we are seeing - we expect the markets to move higher here and consolidate - there are some indicators that are overextended - but we think the trend is higher and for the S&P  (as stated earlier) is to head to 1960-1970 range.  

Some stocks are looking really good from our buy signal report on our reports page under the TUHQ Fast Trade Buy SIGNALS report at: BUY Signal Reports.  Check out this very good reports page which shows our predefined scan results end of the day.  You can use the mouseover chart feature to scan through many stocks very quickly. A feature that was designed by a team of hedge fund managers.

Long AAPL, T, USO and TUBE.

Trucharts team

October 19, 2014

Trucharts.com end of weekly blog update - 10/17/2014

Trucharts.com end of week Blog update 10/17/2014

What a week of market gyrations.  It had our head spinning.  We were expecting volatility – but this was nothing we have experienced in the past two years – since the markets (like we stated before) have been going up in a straight line.  The correlation between the Fed balance sheet and the markets has been moving in tandem.  And then the Fed speaks anytime the markets drop – because obviously all the Wall Street guys are concerned about their portfolios dropping and how this will impact the average investor.  Fed governor Bullard spoke and then we had some other Fed governors speak – as soon as that happened the markets jumped and bounced.  It is like a scripted movie – predictable. Bullard (non-voting member fo FOMC) stated that the Fed should keep the bond buying active – wow!! As if the Fed balance sheet is not big enough yet.  It is $4T – yes 4 TRILLION and that has created a bubble in stocks, real estate and every asset.  Bonds had moved higher into this volatility and the VIX spiked to a high of 31+ and then settled the week at 21.99. We expect the VIX to pull back and bring some sense to back for some time into the markets.  There are some interesting charts we have shown below and with comments and trendlines indicated.  We are short IBB still and GM.  We expect NFLX to pull back and since we have earnings coming up from AAPL and many big names next week – we would like to stay on the sidelines and keep our powder dry.  We went long USO even though we think the correction in the OIL/energy sector is not over.  Gold did bounce but the long term chart looks weak.  Gold miners are getting slaughtered.
We have added one of our unique sentiment indicator charts at link:  http://www.trucharts.com/MarketSentiment_ISEE.aspx
This is of VIX vs SPY500 and you can see clearly how the VIX spiked significantly last week.
We have added the charts for LUV (Southwest airlines) – position closed last week.  DAL short closed last week – even though we may retake the short positions in these later.  Our SNDK profit was 150% – Oct 92.5 puts – we bought at $4 and it closed and sold for $10 on Friday expiration.
XLE chart shows breakdown in the energy sector.
QQQ bounced exactly off the 50 week average – see chart below.
The volatility did allow day traders to take advantage of the daily moves in the markets/stocks.  One of our fund manager friend who manages a S&P futures fund made the highest return and the return for the week was a whopping 17% and the YTD  return has been 64% with a hit ratio of 96.5%.
If you are interested in discussing this with our hedge fund manager – please contact us at support@trucharts.com and or at bbhatia@trucharts.com.  Please keep in mind that the minimum investment required is $50K or $100K.  
Here is the weekly return chart for past 32 weeks.  As you can see the return is low when volatility is low – but none the less positive.


Best of luck trading next week;
Trucharts team

October 17, 2014

Trucharts.com - Stock Charts - Market Rally - ALL Indices up

Trucharts.com - Blog Update - 10/17/2014 AM

Yesterday at the end of day we said the VIX was extended and we expected some type of rebound - in addition to the markets being oversold. We were expecting this and that is what we are seeing today. Excellent day for traders to make money. We were long USO and TUBE into this rally. The Fed and ECB are the key focus and Fed liquidity is what is driving these markets.  We would sell into these rallies and take profits.  We expect this to last into next week since many major earnings will be out from many bgi names next week.  Keep your powder dry and if you are a great trader you can make some money here.
Watch XLNX and the oil sector for a bounce (oil sector was very oversold).  Watch for a pullback in the VIX.

Trucharts team

October 16, 2014

Trucharts.com - Markets closing brief - 10/16/2014


Trucharts.com - Markets closing brief - 10/16/2014

The markets had a very volatile day today.  VIX spiked and then pulled back.  We have been saying that the market moves will be exaggerated with VIX flirting with above 20 levels.  Stocks, obviously gyrated between being positive and negative moves - and very wide intraday moves - excellent for day traders if timed correctly.  Biotech stocks were up and down and we need to monitor the closing of these stocks, the markets and indices tomorrow.  Google announced earnings that missed expectations - stock was down after hours.  We are watching oil since it is already in a bear market with a correction of 20%+.  We took a position in USO today for a possible move up from a corrective move - but will require patience.  Stop is at 28 for USO.  

Semiconductor stocks bounced today from a correction move down after SWKS (Skyworks) after making a higher earnings/revenue announcement.  We believe the market is oversold in the short term and we would expect some type of bounce and drop in the VIX.  But we will watch this closely. 

Check out the features on our site like real time news, stock scanner, stock backtest feature, automated buy/sell signals with our trading strategies.  There is a free trial sign up period: check our subscription price and for the price of 3 cups of Starbucks coffee you can get access to our site features.  We will publish our weekly update this weekend.  Here is a chart with our buy/sell signal strategy which shows :the NFLX signal before the carnage. 

We discussed NFLX in our blog 2 days before the huge drop and here is the chart with the red down arrow showing the sell signal right before the carnage.  Carl Icahn could have also saved some headache from this drop :-)...


We are still short GM/IBB and long USO/T.

Trucharts team.

October 14, 2014

Stock Charts Free - Trucharts.com - IBB chart update

TruCharts.com Blog Update for ETF IBB

Check out this chart for IBB - next support is at 50 week moving average.  Note the RSI and MACD for weekly -  If it breaks and closed below the 50 week - next support is at 220.


October 12, 2014

Stock Charts - Trucharts.com - Blog Update ending 10/10/14

Trucharts.com - Blog Update week ending 10/10/2014


Well what a volatile week this was.  Markets ended on a weak note on Friday.  We stated last week that volatility was high and that it would pull back - well we did get a pullback on Monday but then it moved up significantly by Friday.  There were huge moves in the markets and in oil.  Oil closed below the $85 mark.  Many oil drillers and stocks related to the oil industry are crashing and we think this well affect the Texas economy significantly.  Last week we showed some very good charts on the markets - we indicated that there was underlying technical weakness even as the markets were moving higher.  The RSI and MACD were weak and this is where techncial analysis becomes very useful. We believe that there is incessant selling in the oil stocks due to margin calls.  Just check the stock charts for APC, CLR, APA, HAL and many more.

The gold miner stocks are also getting crushed.  We still like gold - we suspect it has bottomed here for a short time - but the long term trend is showing a possible price target of $1000.  We will keep a close eye on this.
Last week there was news from Microchip (MCHP) that affected the semiconductor sector.  We had been short SNDK and SIMO.  We think this is real weakness and expect this to continue through into 2015.  Check the charts for NXPI, AVGO, LLTC, XLNX, LRCX, KLAC and many more in this sector at: www.trucharts.com/stockview.aspx.  This sector is in major correction mode as is the NASDAQ.

We indicated that we would be shorting HPQ, SNDK, GM and we took short positions in these stocks.

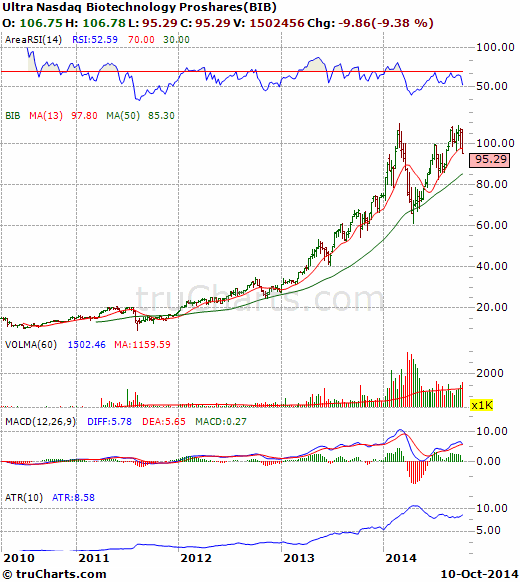
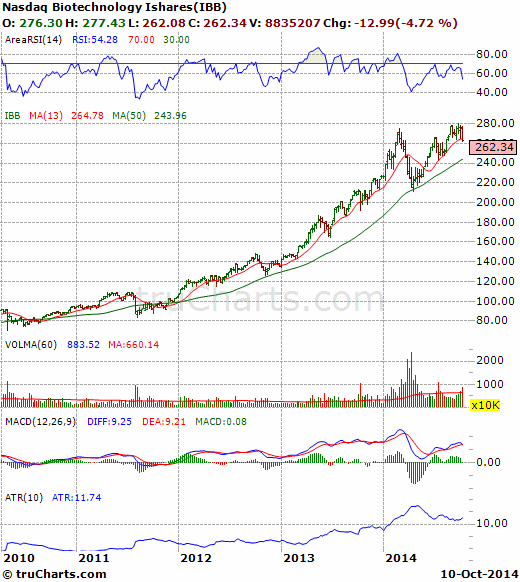
Now for the next sector which we have been indicating is in bubble mode and should see a correction or major pullback - we are long BIS and short IBB.  We have been showing these charts for the past 2 weeks.  Here is the chart for IBB and BIB - note the close belowe the 13 week average for the first time in over 12 weeks - also note the technical weakness in the RSI/MACD and volume. The next support is at the 50 week moving average.

BIB stock chart
BIB weekly close
Stock Chart IBB weekly
IBB weekly chart